boxplot
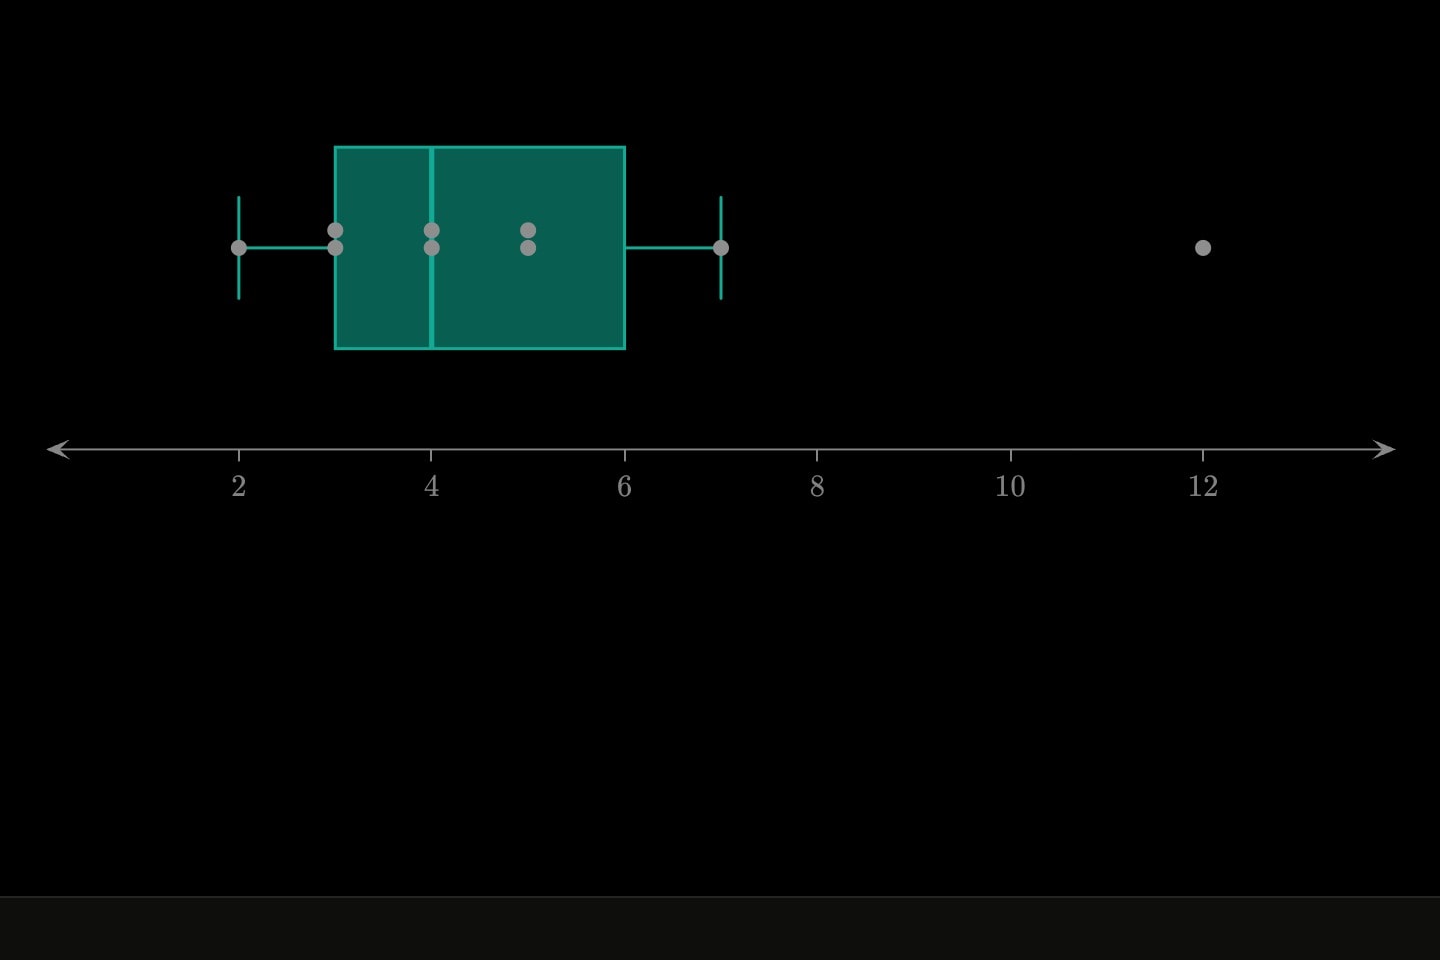
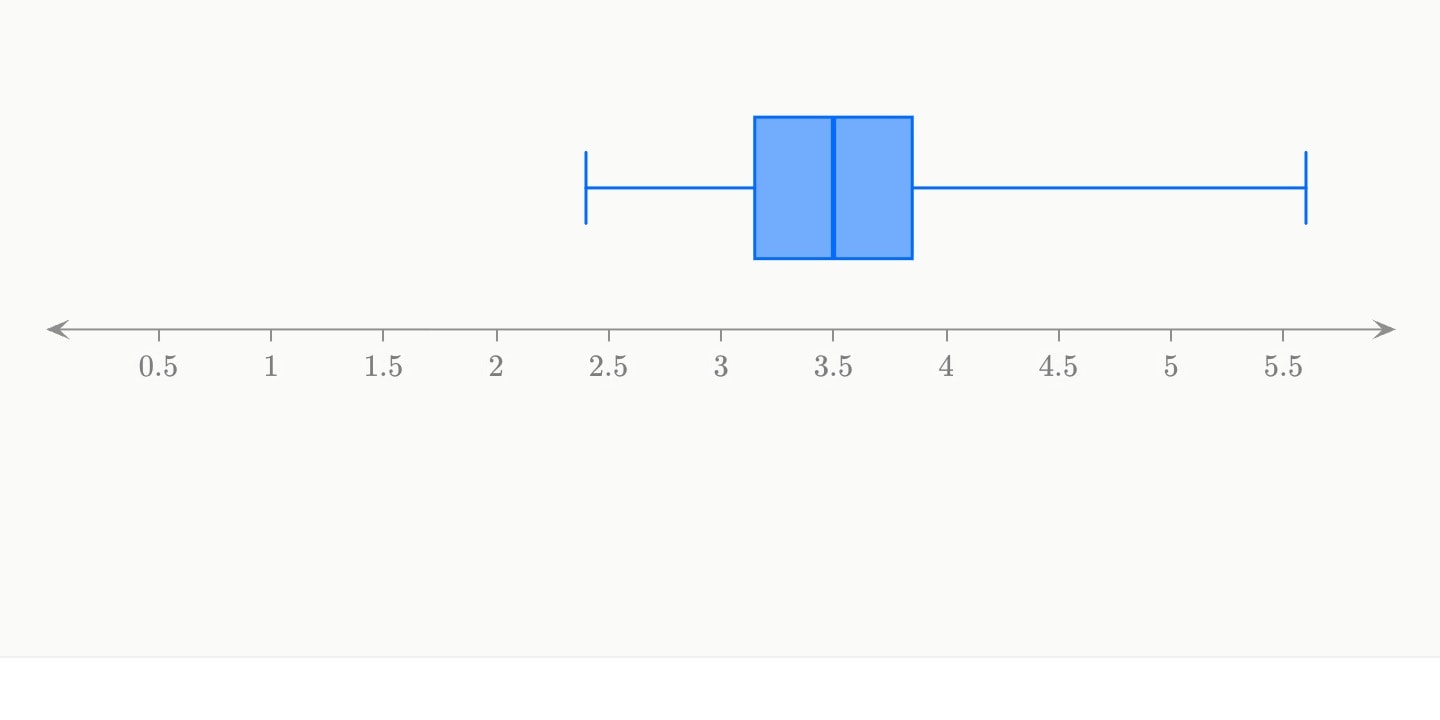
A sample drawn as its five-number summary: a box across the quartiles, the median ruled across it, and whiskers.
boxplotxxyargandplane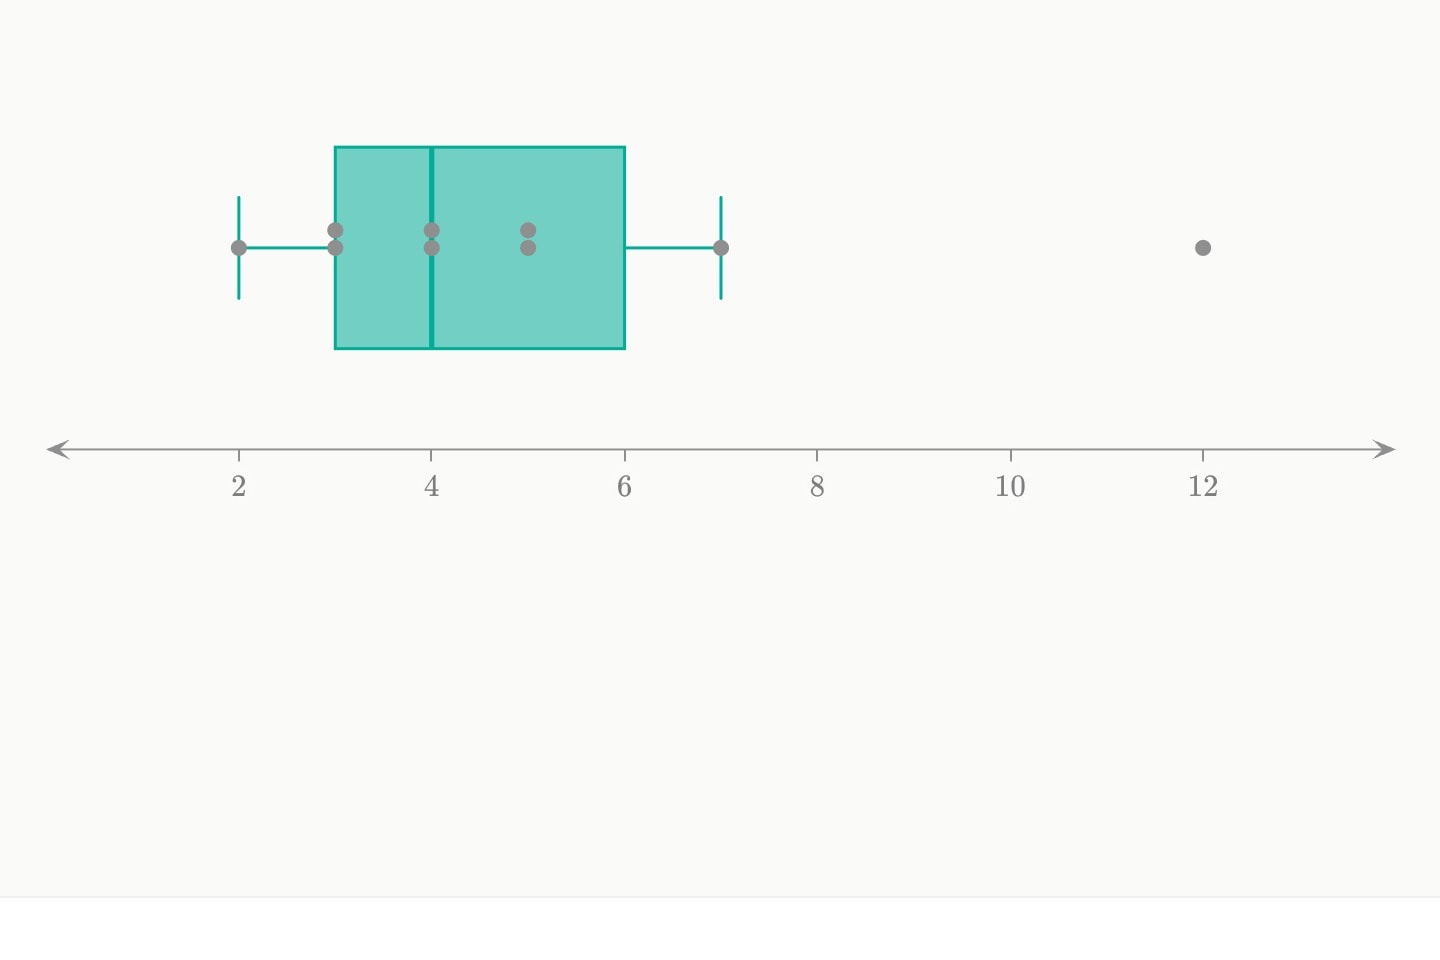
#What the box computes
A box takes the readings and works the summary out. The quartiles are Tukey's hinges: the median splits the ordered readings in two, itself in neither half when the count is odd, and each quartile is the median of its half. The box spans the quartiles with the median ruled across it. A row that is not a number drops.
whiskers: fences, the default, stops each whisker at the furthest reading within one and a half interquartile ranges of its quartile and draws every reading beyond as its own dot. whiskers: extremes runs them to the smallest and largest readings and draws no dots; so does a sample whose quartiles coincide. !outliers keeps the fences and leaves the dots off. It is animatable and the frame holds the dots either way, so they can fade in on a step without the axis moving.
median, q1, q3, iqr, min and max. min and max are the sample's extremes whether or not a whisker reaches them.#One sample
One coordinate is one sample, and the box lies along the axis it is written on. On the number line it takes a lane above the line. On a plane, on: says where it stands on the other axis — a number, a date, or a name, which joins that axis's names:
boxplot(y: #births.mass)[canvas/stand-on]'boxplot' summarises y and needs 'on:' to say where it stands on x — a number there ('on: 2'), or a name ('on: Control'), which rules the axis in the names its boxes stand at
on: is refused on the number line, and the axis the readings are written on must be numeric (canvas/boxplot-axes). A box and a scatter of the same readings at one place share one slot: the summary lands over the readings, the markers swarm, and the box leaves its outlier dots to the scatter, whose markers they already are.
scene{
    The middle half of the sample spans {{#control.iqr}} g.
}[
    graph:x{
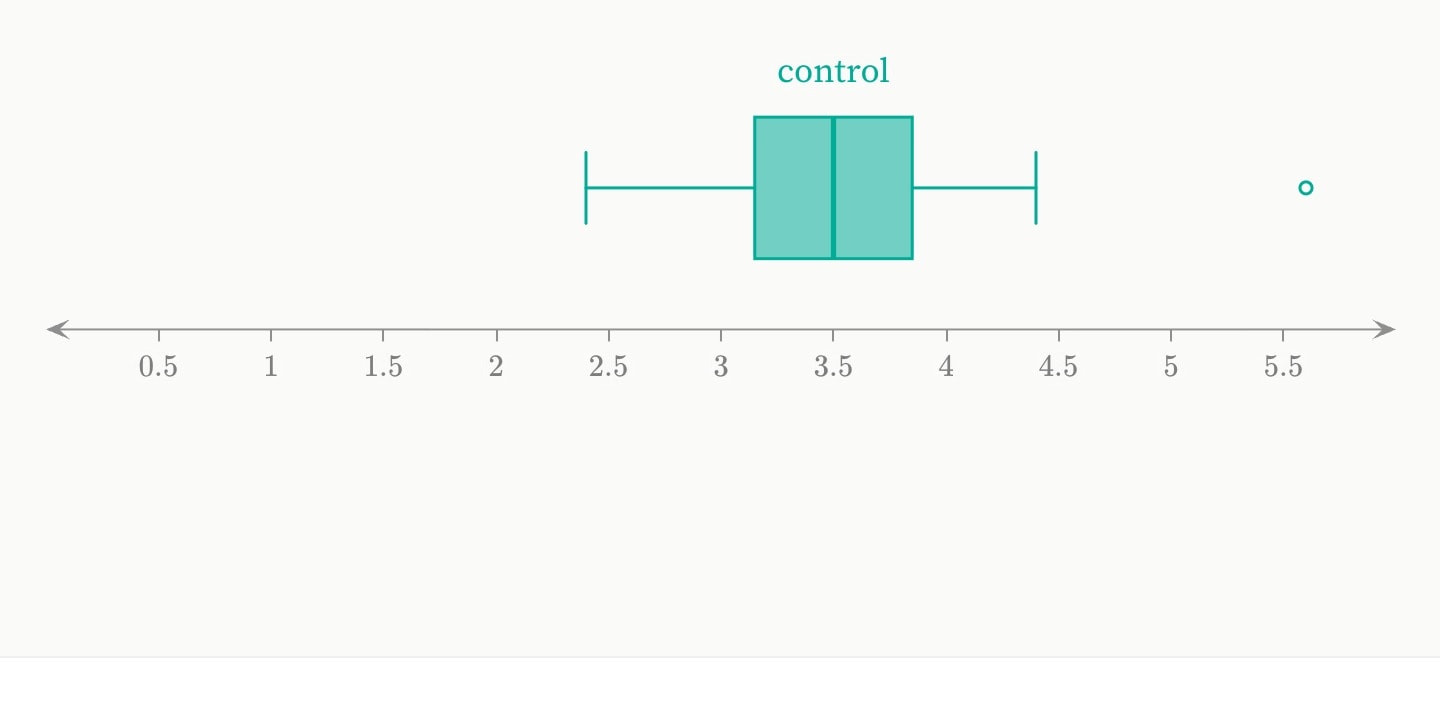
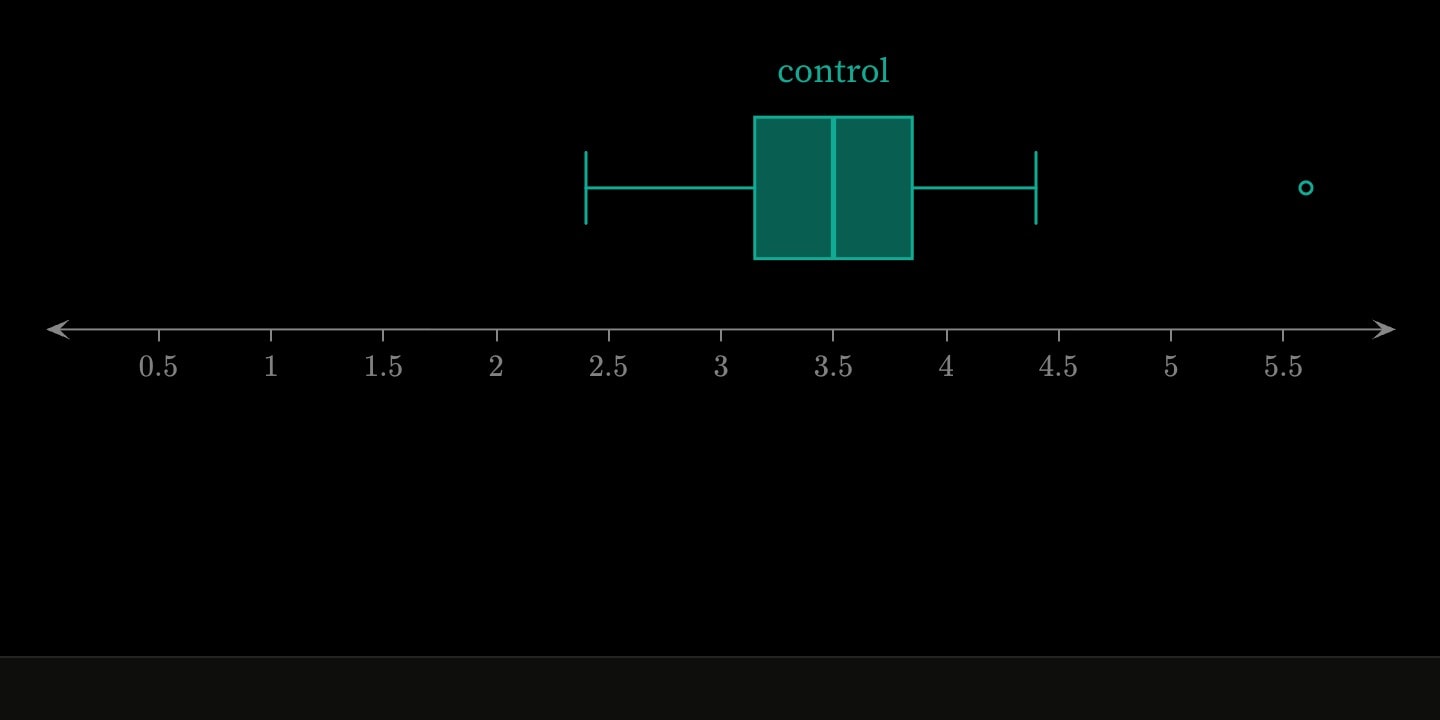
        boxplot#control(x: #births.mass; colour: teal; label: control)
        scatter(x: #births.mass; colour: grey)
    }(
        x axis label: mass (g)
    )
]#A box per group
Both coordinates, one of them a column of names, draw a box at every name, each over the readings in that name's rows — boxplot(x: #trial.arm; y: #trial.mass), the two columns grouped data arrives in. on: is refused, since the names say where each box stands.
on: its name.#A box of paired readings
Both coordinates numeric are one bivariate sample, paired row by row. The box is the rectangle of the x quartiles by the y quartiles with both medians crossed inside it, a whisker from each edge to that axis's fence, and every reading outside either fence as its own dot — drawn over a scatter of the same columns, it lands on the markers it summarises. It publishes each axis's numbers under the axis's name — x-median, y-q3 — and no plain median. on: and band are refused. On the argand plane the pair is re and im, or one complex z, publishing re-median and the rest.
scene{
    Half the trees are taller than {{#cloud.x-median}} m.
}[
    graph{
        boxplot#cloud(x: #trees.height; y: #trees.mass; colour: teal)
        scatter(x: #trees.height; y: #trees.mass; colour: grey)
    }
]#Attributes
whiskersfences stops each at the furthest reading within one and a half interquartile ranges of its quartile and draws every reading beyond as its own dot; extremes runs them to the smallest and largest readings and draws no dots. A sample whose quartiles coincide is drawn to its extremes either way.fencesextremesfencesoutliers!outliers takes them off anyway — for a scene about the middle of a distribution rather than its tails, and for one that puts them back on a step, since it is animatable (outliers: false !cue.to{true}(at: 2)). The frame still holds them, so fading them in does not move the axis. Nothing under whiskers: extremes, which has no reading outside its whiskers. Not drawn where the box shares its slot with a scatter of the same readings: every reading past the fences is one of those markers already.truecolourcolour: grey, teal. Grouped by a column of names, it can also be applied to that column, so each box takes its own name's colour whatever order the boxes stand in: colour: #polls.party -> (DEM: blue; REP: red; otherwise: grey).colour-stylecolorbluestylesolid, hatched, dotted or outlined. One style, or a list box by box.fill-style-stylesolidbandscatter's band: is a share of, so a box and its markers are measured against one thing. The whisker caps are half of it, so one number sets the weight of the whole mark. Nothing to a box of a pair of samples, whose thickness is the spread of the second sample.0.5opacity1label$maths$ and inline formatting render. Fades and draws with the element.hiddenhidden: true !cue.to{false}(at: 2) reveals it — and unlike a cue, a hidden element still frames the plot, so the axes do not jump when it appears. It holds its slot the same way, drawn yet or not, so a box arriving on a step lands beside the marks already there rather than moving them.falselockeditable: graph. Nothing at all on a graph that is not editable.lockedfalsetext-size20layerz: before the argand plane took that letter for its coordinate.groupgroup: Treated, Projected. It is drawn in the colour of the first group that has one, over its own colour:, and the footer's key names every group. A stroke the graph's key: gives a group does not change it.xplanex#trial.mass). The sample itself, not a summary of it: a summary written by hand cannot be checked against the sample it claims to summarise. A row that is not a number drops.boxplot:valuexyplanex#trial.mass). The sample itself, not a summary of it: a summary written by hand cannot be checked against the sample it claims to summarise. A row that is not a number drops.boxplot:valuey#trial.mass). One coordinate is one sample. x: and y: together, with one of the two axes ruled in names, are a sample grouped by those names — a box at every name over that name's rows; both numeric, they are the paired readings of one bivariate sample, row by row, and a row missing either half drops whole.onaxis.label takes. Required on a plane for a box written with one coordinate, since the second axis is an axis and a box laid across it by lane would be asserting a coordinate its sample does not have. A name joins the axis's names, so boxes written on: control and on: treated rule the axis in those names with no x format: line, and a scatter with the same on: stands in the same place. Refused on the number line, whose boxes take a lane each; on a grouped box, whose names column already says where each box stands; and on a box of a pair of samples, which stands where its readings put it.argandplanerere: and im: alone is one sample; the pair is one bivariate sample, which z: writes as a single list.imre: and im: alone is one sample; the pair is one bivariate sample, which z: writes as a single list.zre: and im: written apart are the same box. A complex column binds here, there being no way to split one into two real ones.onaxis.label takes. Required on a plane for a box written with one coordinate, since the second axis is an axis and a box laid across it by lane would be asserting a coordinate its sample does not have. A name joins the axis's names, so boxes written on: control and on: treated rule the axis in those names with no x format: line, and a scatter with the same on: stands in the same place. Refused on the number line, whose boxes take a lane each; on a grouped box, whose names column already says where each box stands; and on a box of a pair of samples, which stands where its readings put it.#Derived attributes
Computed while the element renders — read one with #id.name in attribute position or {{#id.name}} in prose, never set.
medianq1q3iqrq3 − q1 — the width of the box. Published by a box holding one sample; a box grouped over several names publishes none.minmaxmeancountxyplanex-medianmedian, which a sample of pairs does not have.x-q1q1, which a sample of pairs does not have.x-q3q3, which a sample of pairs does not have.x-iqrq3 − q1 — the width of the box. Of the readings on the x axis: a box of a pair of samples publishes each axis's numbers under that axis's name, and no plain iqr, which a sample of pairs does not have.x-minmin, which a sample of pairs does not have.x-maxmax, which a sample of pairs does not have.y-medianmedian, which a sample of pairs does not have.y-q1q1, which a sample of pairs does not have.y-q3q3, which a sample of pairs does not have.y-iqrq3 − q1 — the width of the box. Of the readings on the y axis: a box of a pair of samples publishes each axis's numbers under that axis's name, and no plain iqr, which a sample of pairs does not have.y-minmin, which a sample of pairs does not have.y-maxmax, which a sample of pairs does not have.x-meanmean.x-countcount.y-meanmean.y-countcount.argandplanere-medianmedian, which a sample of pairs does not have.re-q1q1, which a sample of pairs does not have.re-q3q3, which a sample of pairs does not have.re-iqrq3 − q1 — the width of the box. Of the readings on the real axis: a box of a pair of samples publishes each axis's numbers under that axis's name, and no plain iqr, which a sample of pairs does not have.re-minmin, which a sample of pairs does not have.re-maxmax, which a sample of pairs does not have.im-medianmedian, which a sample of pairs does not have.im-q1q1, which a sample of pairs does not have.im-q3q3, which a sample of pairs does not have.im-iqrq3 − q1 — the width of the box. Of the readings on the imaginary axis: a box of a pair of samples publishes each axis's numbers under that axis's name, and no plain iqr, which a sample of pairs does not have.im-minmin, which a sample of pairs does not have.im-maxmax, which a sample of pairs does not have.re-meanmean.re-countcount.im-meanmean.im-countcount.#Allowed in
#Examples
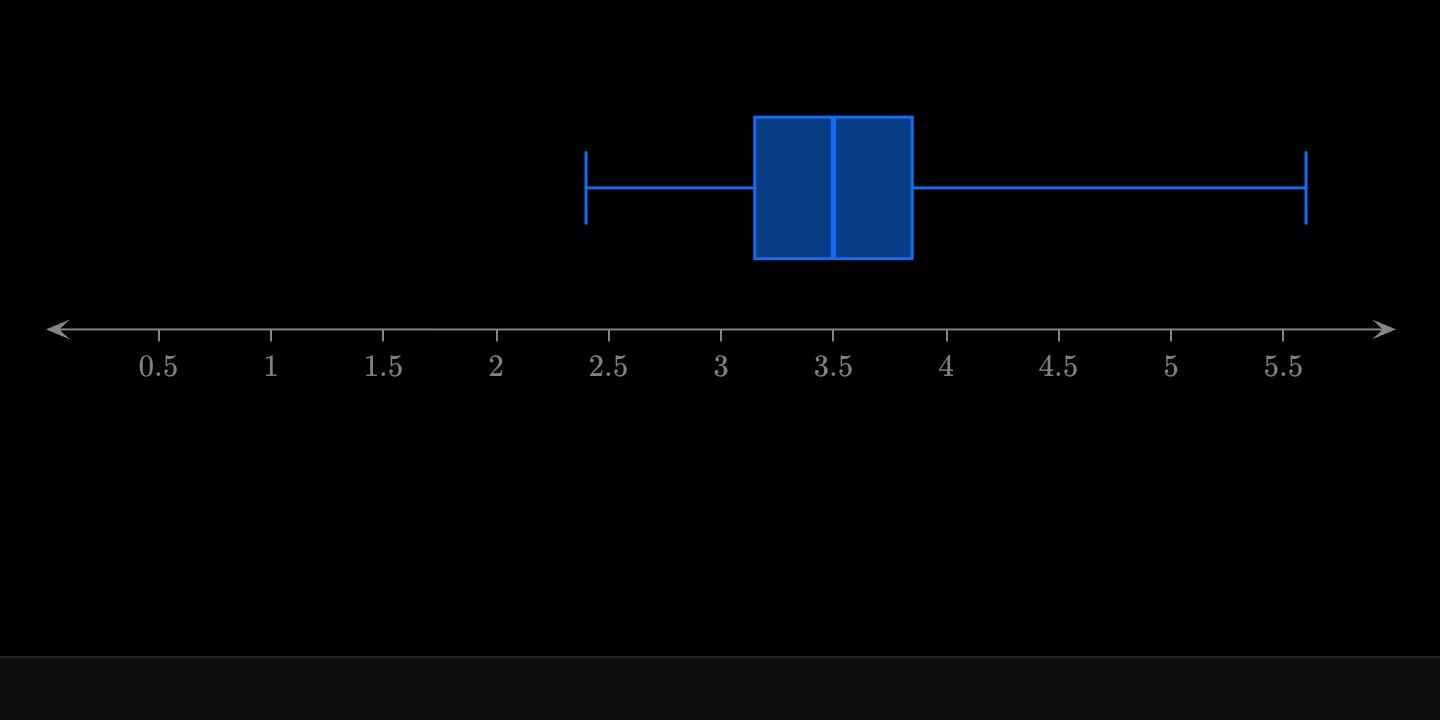
graph:x{
    boxplot(x: #trial.mass; colour: teal; label: control)
}
graph:x{
    boxplot(x: #trial.mass; whiskers: extremes)
}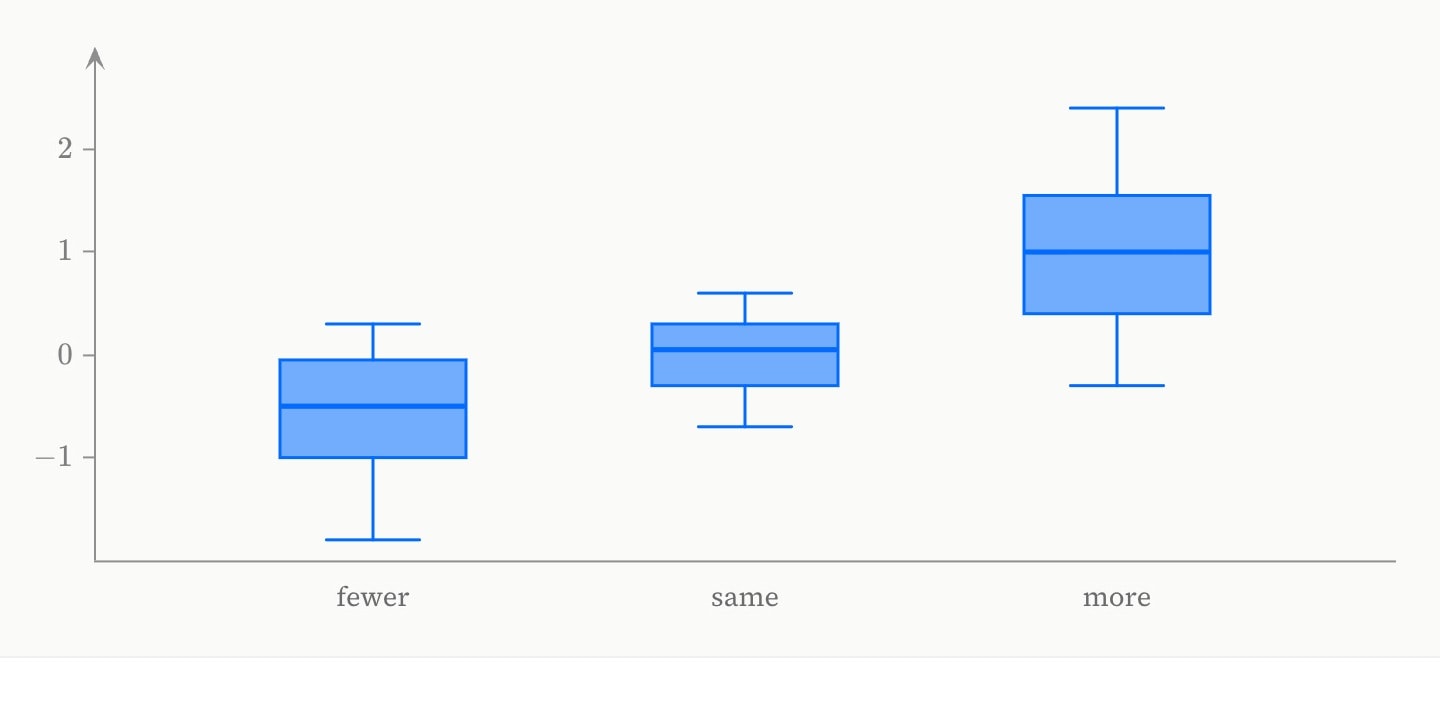
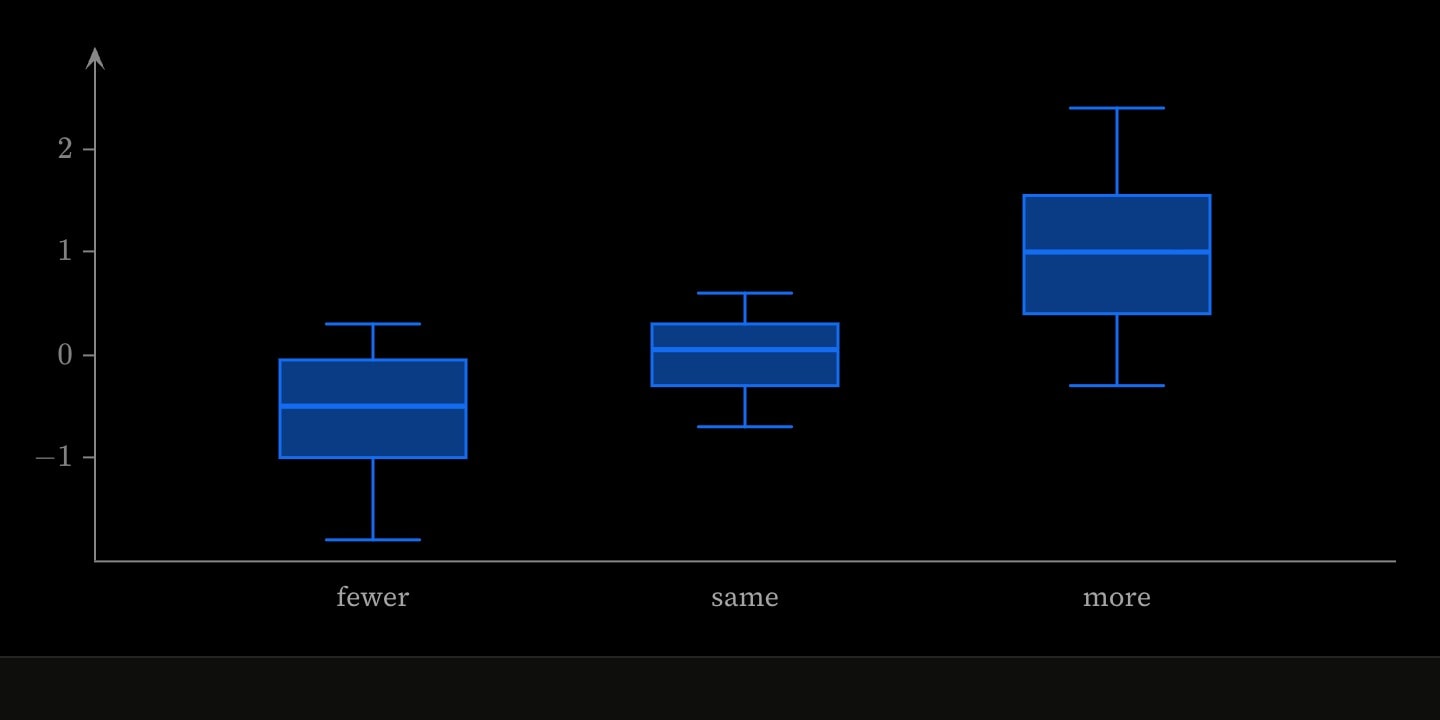
graph{
    boxplot(x: #studies.change; y: #studies.impact)
}