region
A canvas environment that draws a map: boundaries, and the overlays set over them.
region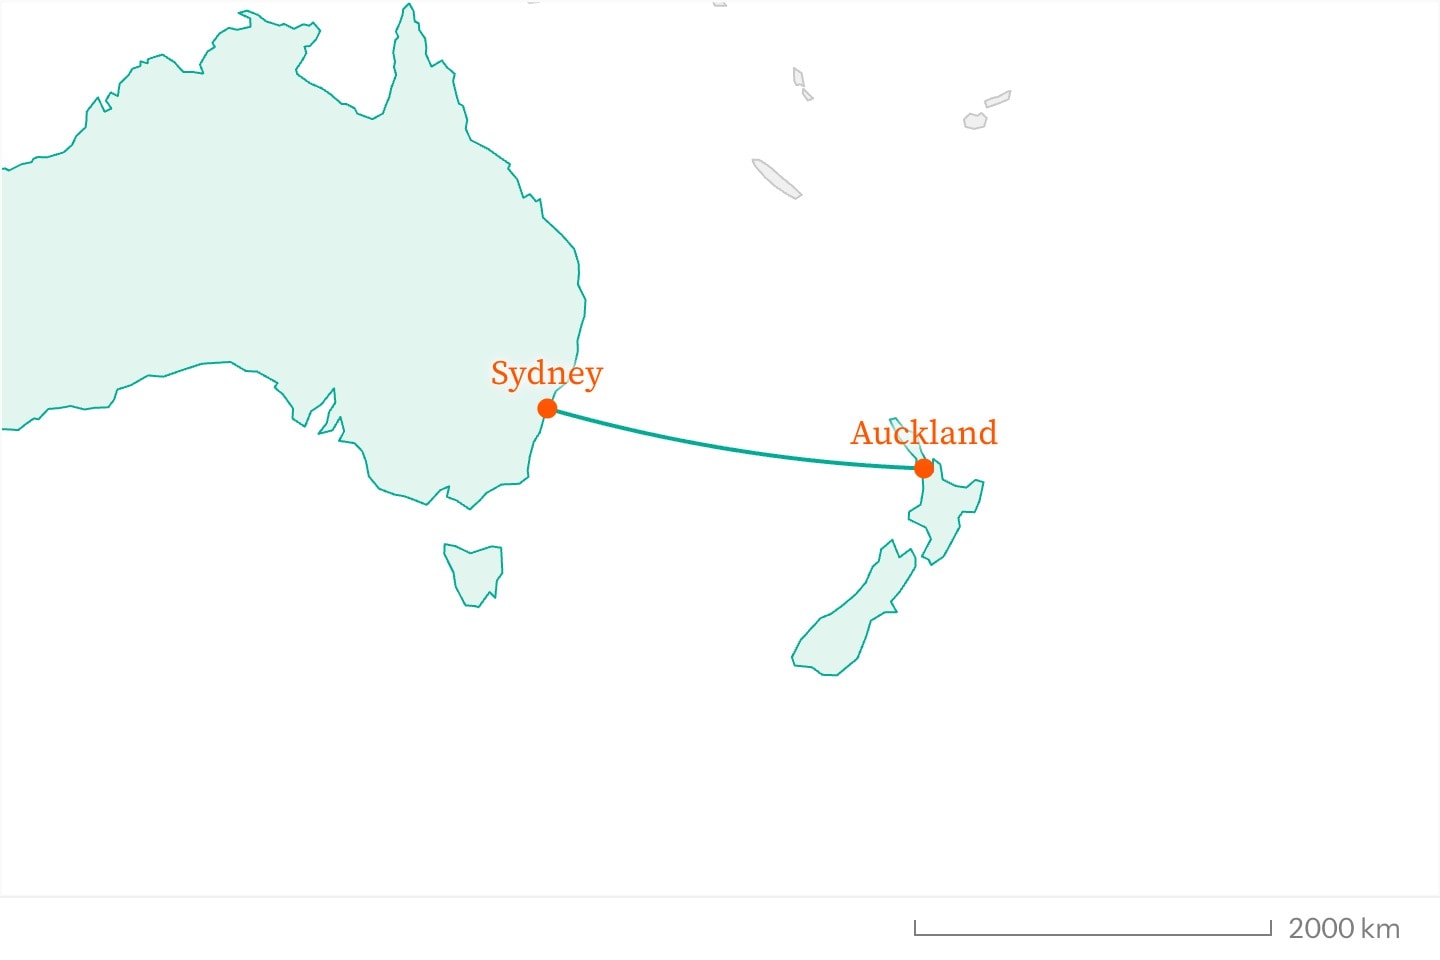
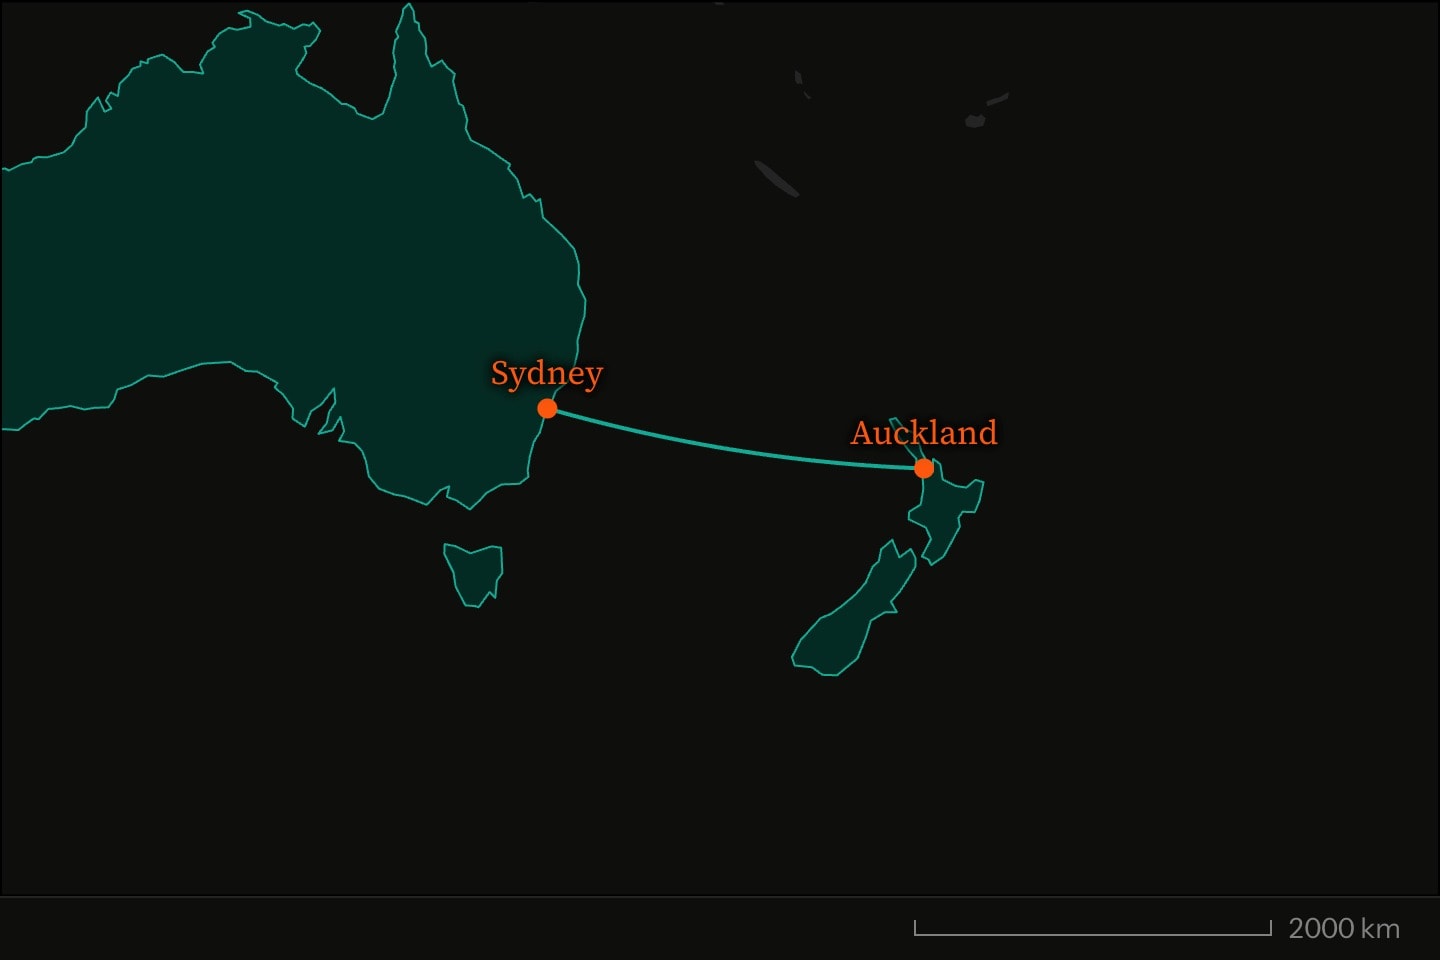
#Boundaries and projections
region is a map. Its implicit attribute is basemap, the boundaries drawn beneath everything else, so region:world{ } is already a world map. The packs are world (Natural Earth's 1:110m countries) and six sets of first-level divisions: us-states, canada-provinces, australia-states, uk-counties, nz-regions and europe-admin1. Without basemap, nothing is drawn but the overlays.
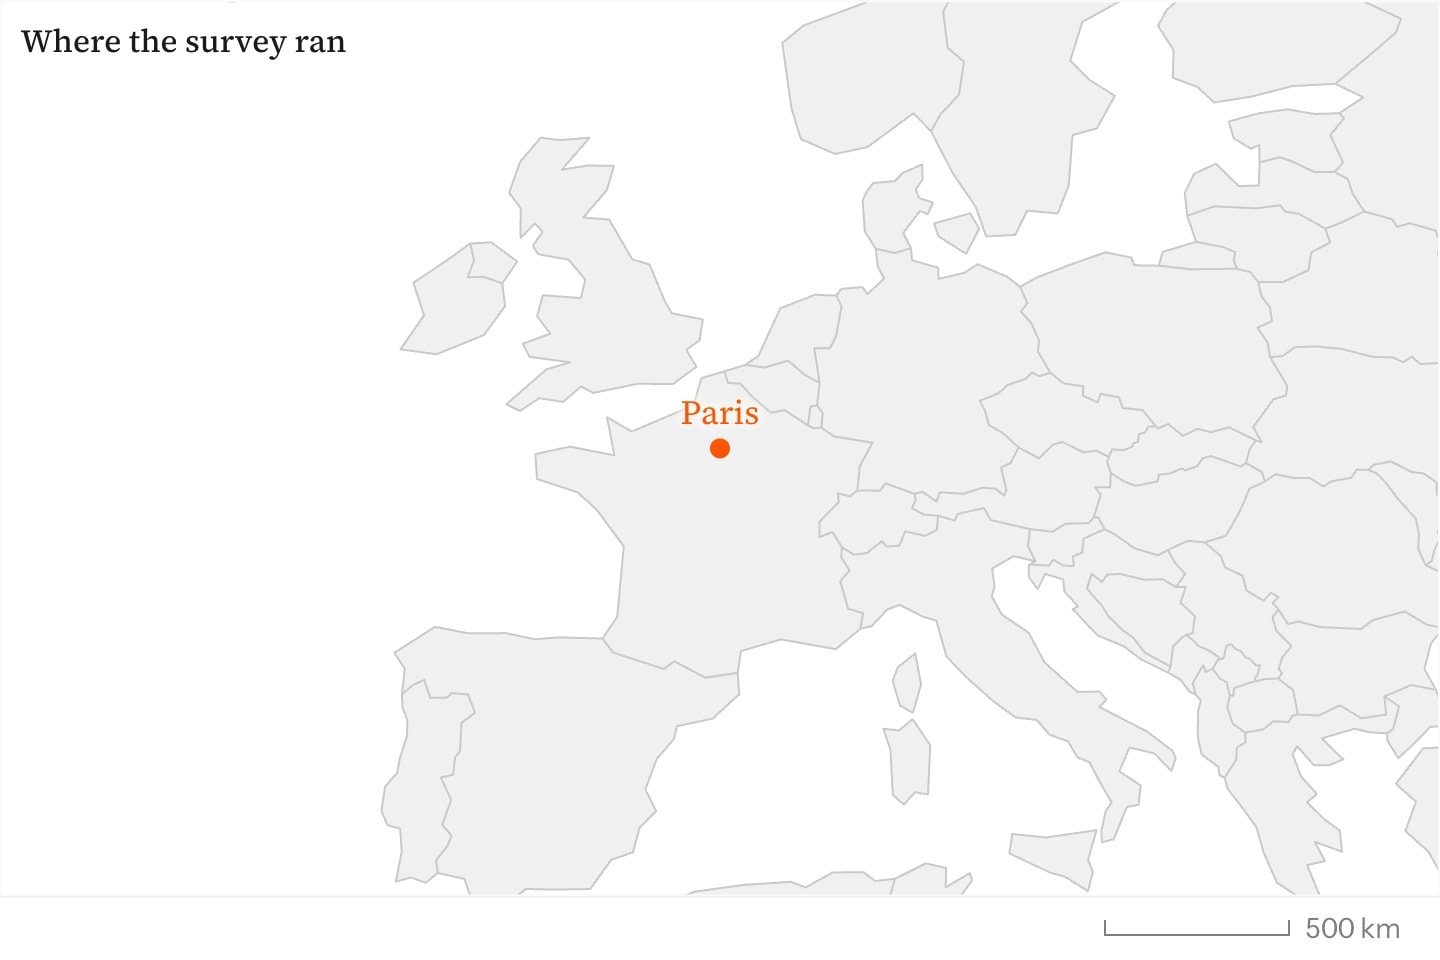
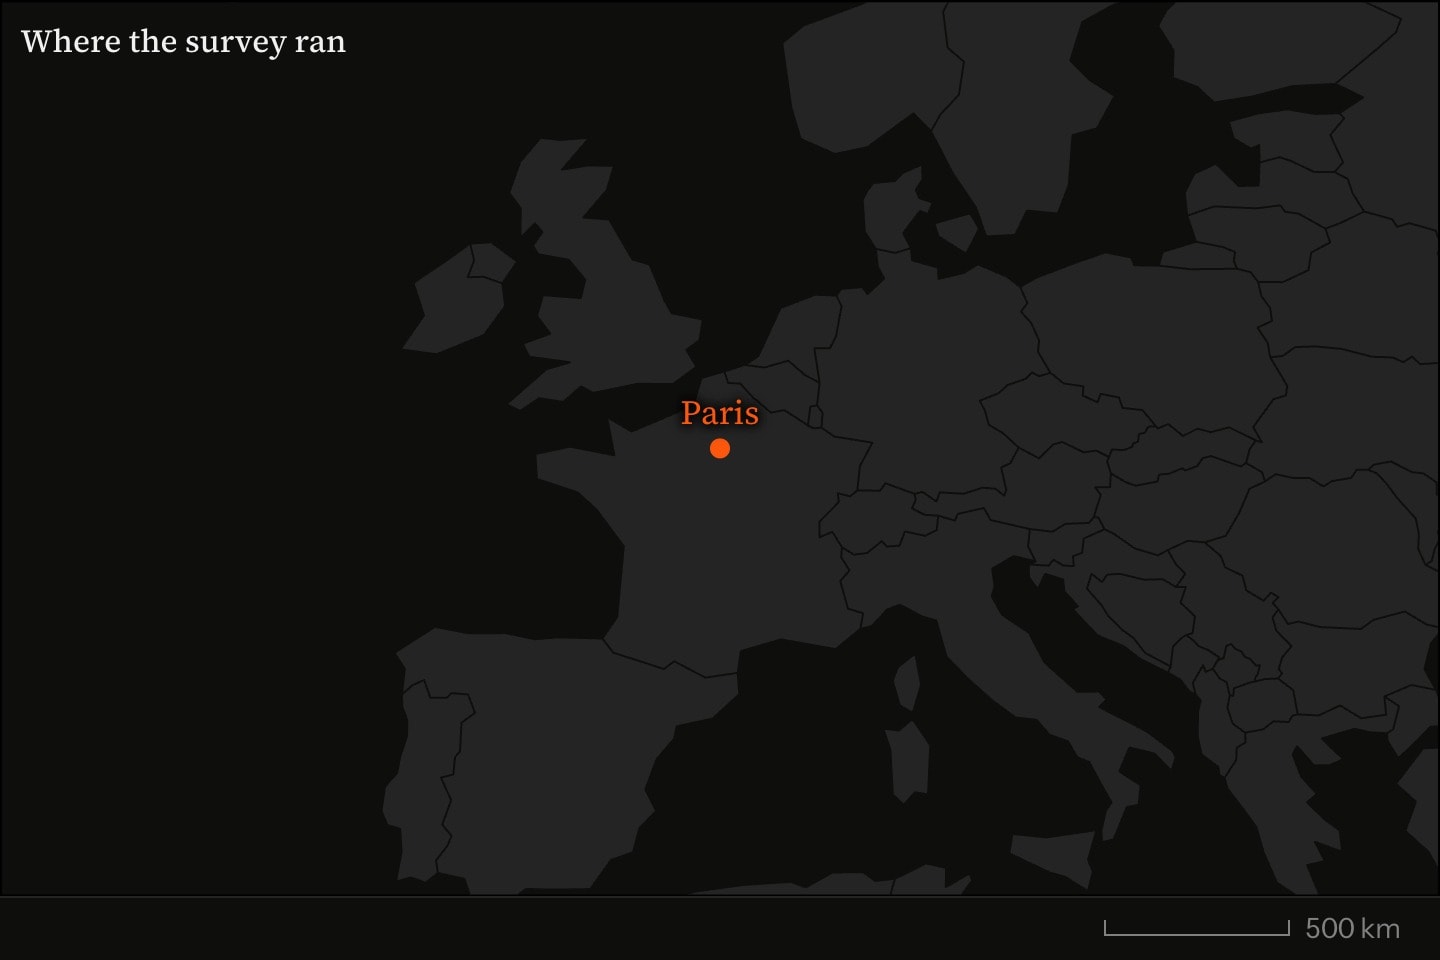
region:world{
    marker(at: 48.85, 2.35; label: Paris)
}(
    title: Where the survey ran
    centre: 48.85, 2.35
    zoom: 4
)
Boundaries no pack carries, such as electorates, catchments or council wards, arrive as an attached .geojson file declared with , and basemap names it as it names a pack: basemap: #wards. name-property and codes say which property of each feature holds its name and its code. Every boundary is drawn from data the internote carries, and nothing is fetched from a tile server, so a map renders offline and the same in years to come.
projection chooses how the sphere is laid flat, and each choice keeps something true at the cost of something else:
equal-earth, the default, keeps areas true across the world.mercatorkeeps angles true, and is the frame on which a great-circle route visibly bends. It stops at 85° north and south.equirectangularplots latitude and longitude as a plain grid.conicis an equal-area conic whose standard parallels are set from the band of latitude the map frames, for one country or region.albers-usais the standard United States composite: the lower 48 on an equal-area conic, with Alaska at 35% scale and Hawaii as insets.globeis the sphere seen from space, the far hemisphere behind the horizon.
show-scale, on unless turned off, puts a scale bar at the end of the footer saying what a length at the middle of the map is worth on the ground.
#Drawing and picking out regions
The map's own attributes say which regions of its pack are drawn and how. only draws the listed regions and leaves the rest as open ground; except leaves the listed ones out. Both take names or ISO alpha-3 codes, ignoring case and accents: France, DEU and Côte d'Ivoire all read, and on world common names such as Ivory Coast too.
highlight picks regions out, named the same way: they take fill and stroke, and the rest of the map stays plain land. A highlight with no fill is teal, and one with no stroke is outlined in its fill. Without a highlight, fill and stroke paint every region drawn, and border-width sets the width of what stroke paints. The camera opens on what is highlighted, or on what only and except leave.
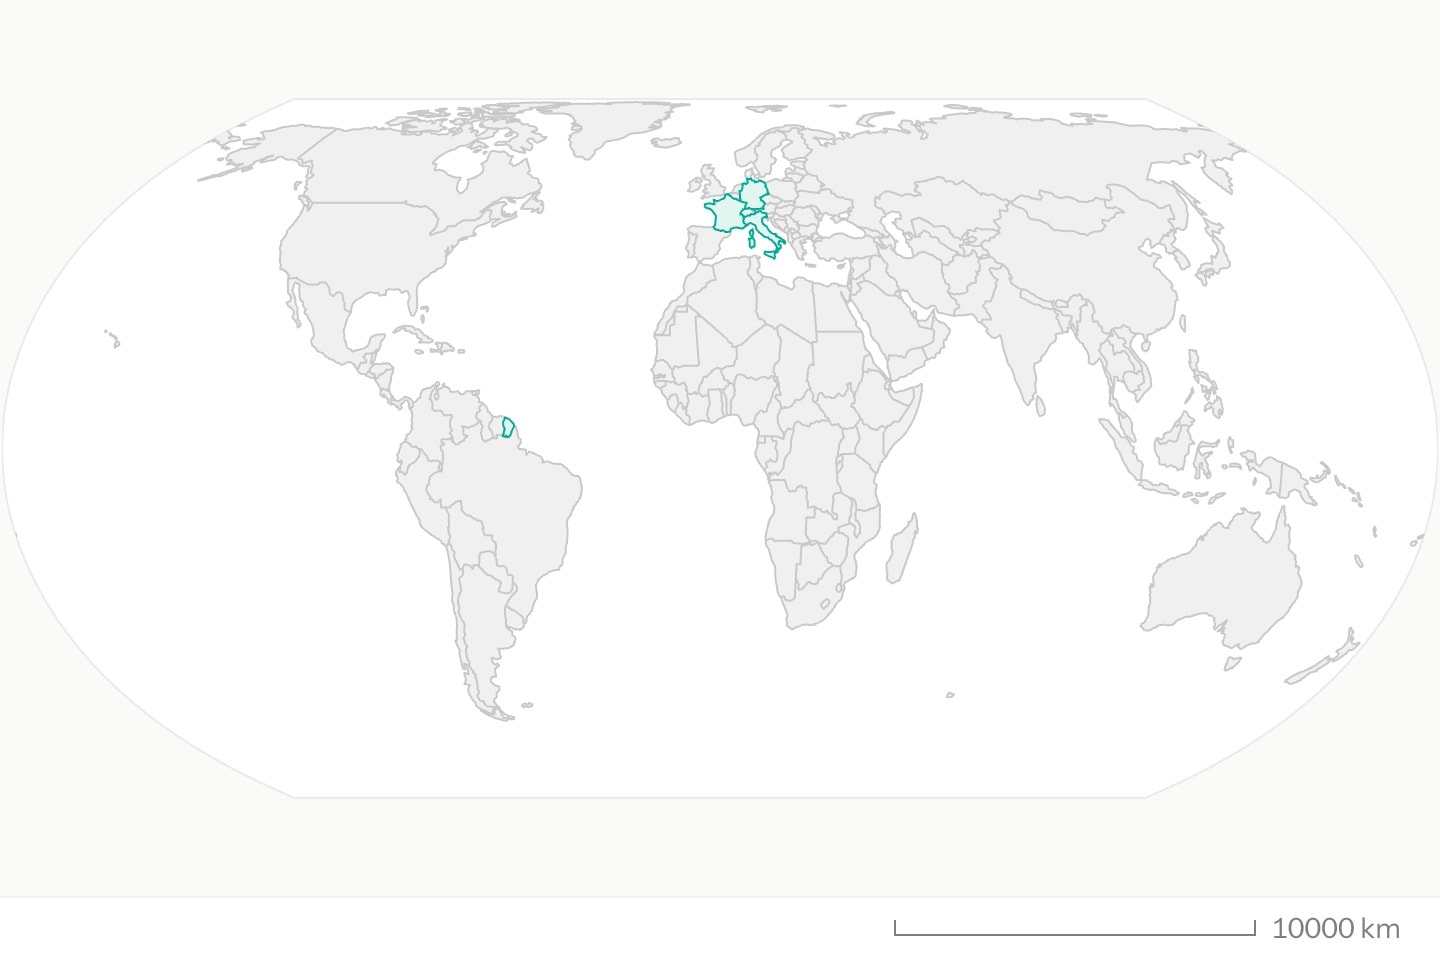
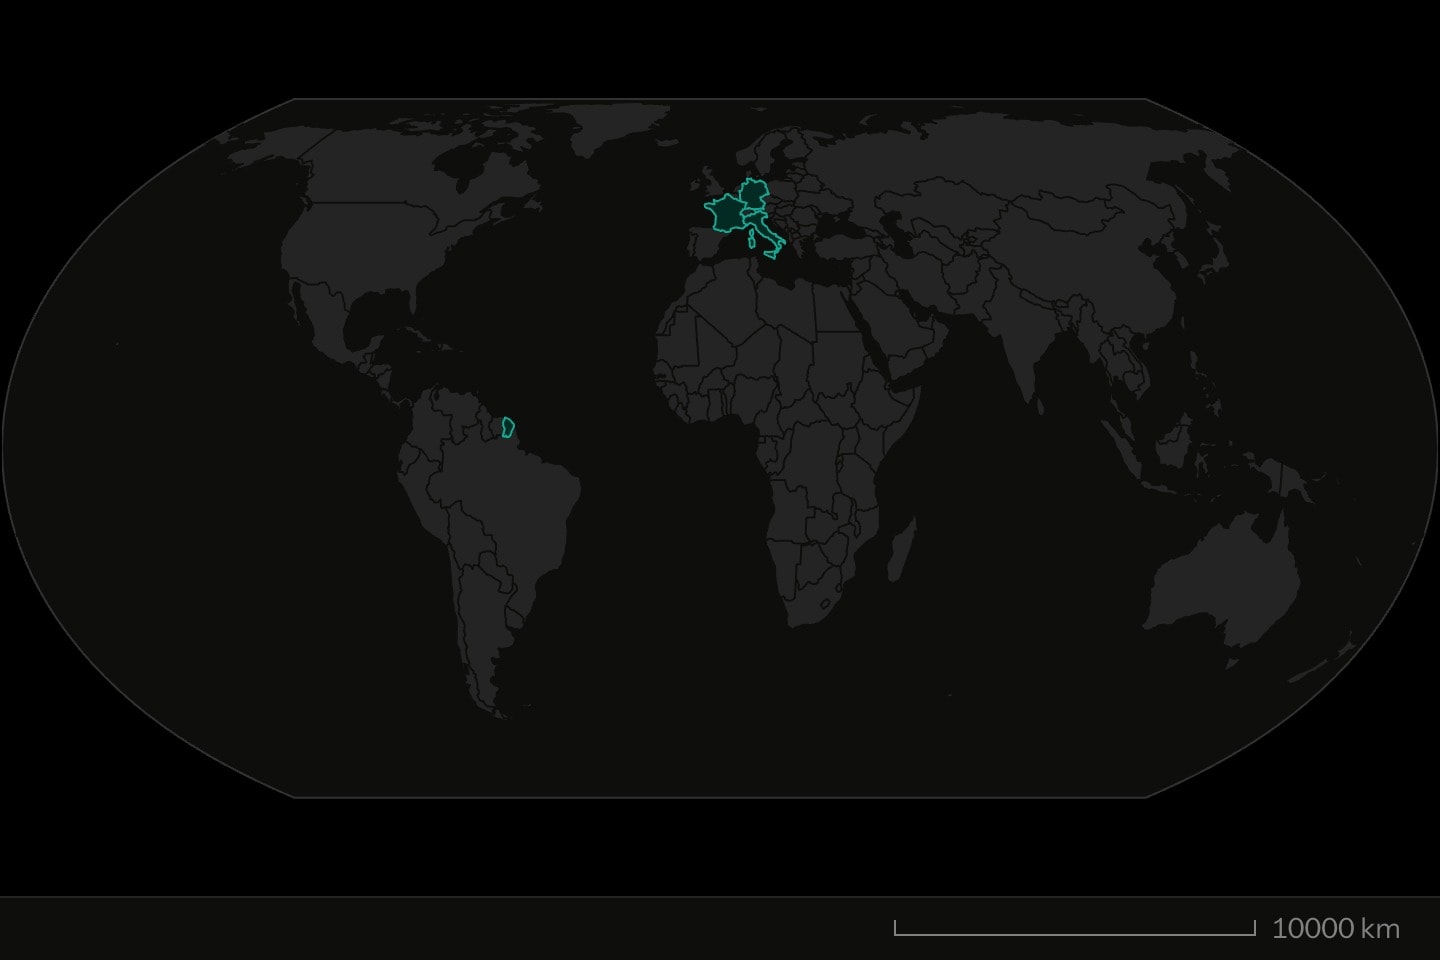
region:world(
    except: Antarctica
    highlight: France, Germany, Italy
    centre: 0, 0
    zoom: 1
)only, except or highlight that matches nothing draws nothing.A map has one set of boundaries. Data on a second pack is a choropleth with its own basemap, below.
#centre, zoom and the fly-to
The frame is a camera: centre, latitude first, and zoom, in web-map levels where each level halves the span. On equal-earth, mercator and equirectangular, zoom: 1 fits the world's width; on a globe it fits the sphere; on albers-usa it fits the composite. Zoom runs from 0.5 to 9.
Omit them and the environment fits what it draws across every step, keyframes included, so a marker that travels stays in frame for its whole journey. Markers placed with at, arc ends, choropleth packs and the regions the map picks out count; data-bound markers do not. A single marker opens at zoom 0.5, centred on it. albers-usa does not fit: it opens on the lower 48.
Both are animatable, and a !cue.to on each with the same anchor flies the camera from one frame to the other. centre may also name a marker the map draws, centre: #tokyo, so a map framed on a place it also pins states the place once; a keyframe from one marker to another glides between them.
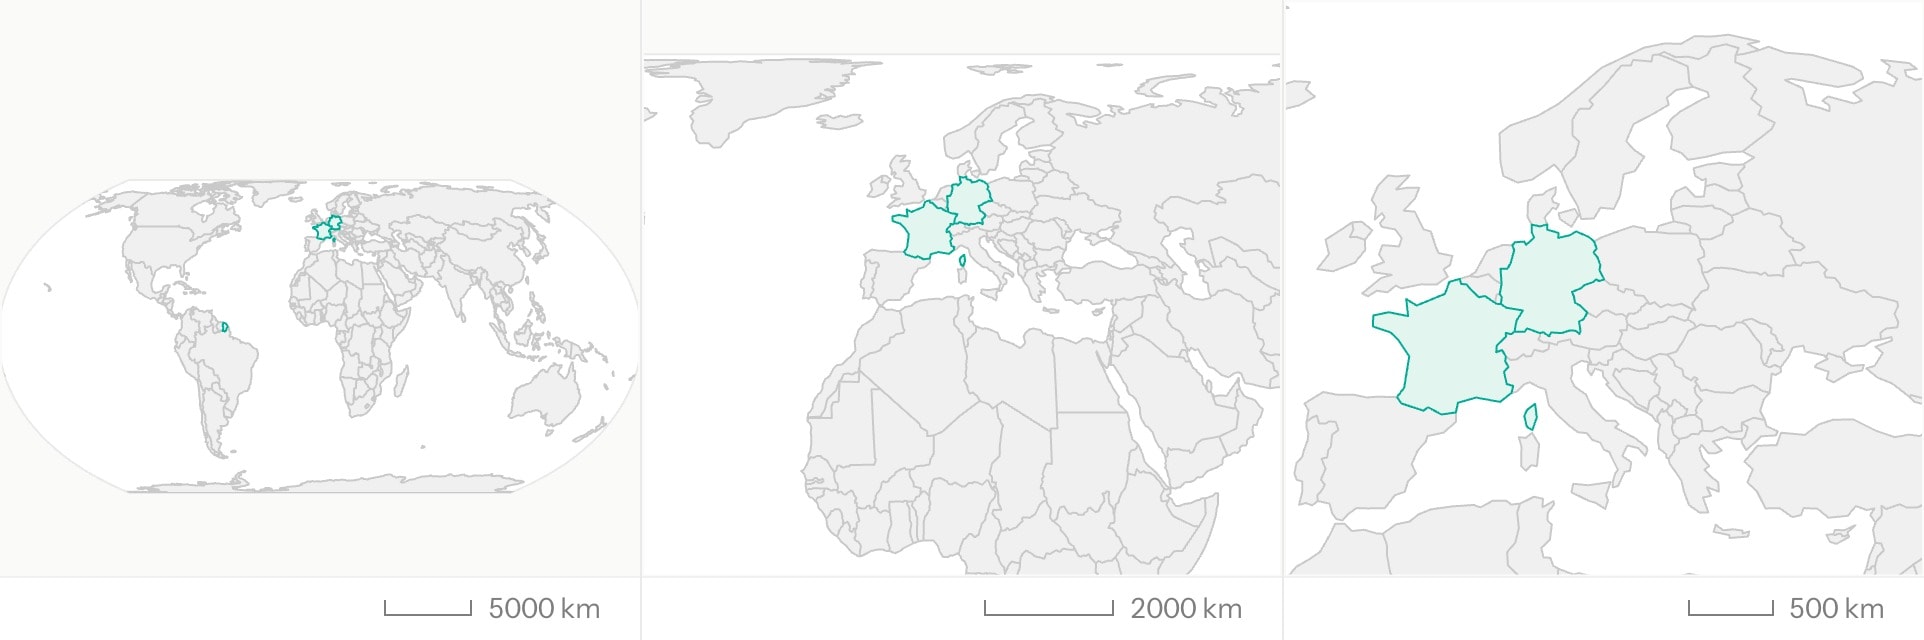
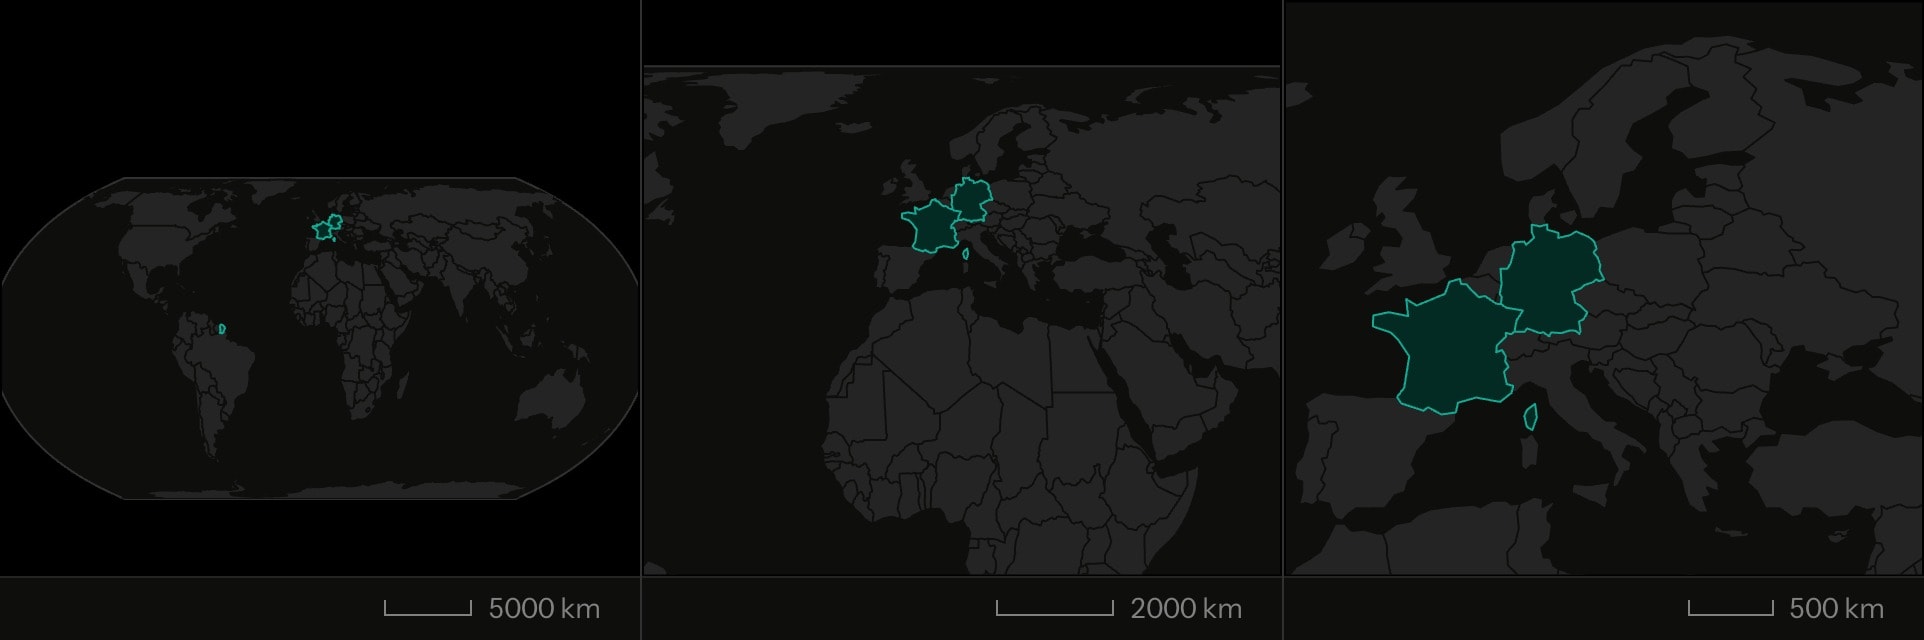
region#tour:world(
    highlight: France, Germany
    centre: 20, 0 !cue.to{50.5, 15}(at: 1; duration: 900ms)
    zoom: 1 !cue.to{4}(at: 1; duration: 900ms)
)
interactive hands the camera to the reader: scroll to zoom, drag to pan, double-click to reset. The reader cannot zoom out past the frame that fits the map's subject, or past 0.5 on a world map or a globe, nor pan away from it. Their camera then overrides the authored one for the session, and continue: #id carries it into a later region environment that is itself interactive. The scene's parameters do not travel with it.
#Overlays
Everything drawn over the boundaries is an overlay, and the three take opacity and hidden, which is animatable, so hidden: true !cue.to{false}(at: 2) is a reveal. Of the cues, a region body takes cue and cue.draw, plus the controls and their cue twins; cue.highlight and cue.spotlight are refused.
#Joining a dataset to regions
choropleth joins a dataset onto a pack's regions and shades them. regions names the column of region names or codes, matched as only matches, and values the column to shade by. A region the data does not cover keeps the plain land fill.
values is a column of numbers: where along a scale each region sits. colour is the scale: multicolour (the default, violet to red), temperature (blue through white to red), or a single hue's own intensity. range pins the ends of the scale; without it they are the least and greatest values.
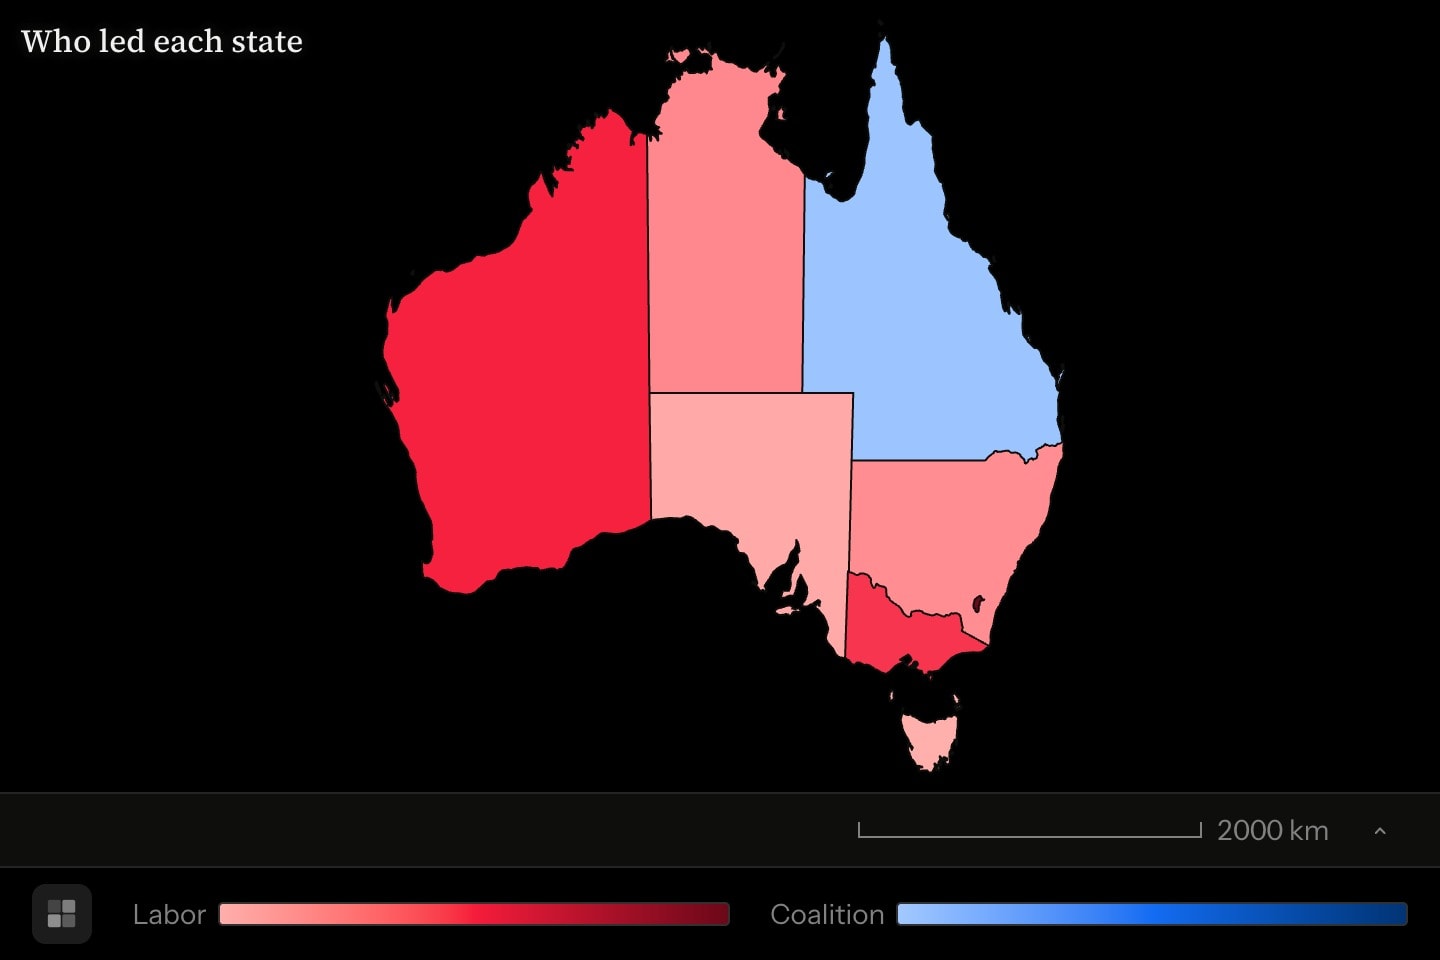
values column of words compiles but shades nothing.Where one scale will not do, colours names a column holding a scale for each row. Rows sharing a cell are one group in the legend, and labels names the column that says what to call it. Each region is still placed along its own scale by where its value sits between the least and greatest on the whole map. An electoral map is written this way: the winner names the colour and the margin says how solid it is.
region:australia-states{
    choropleth(
        regions: #vote.state
        values: #vote.margin
        colours: #vote.colour
        labels: #vote.party
    )
}(
    title: Who led each state
)#Places
marker is a point on the earth, in two forms. Singly, at takes a coordinate, latitude first, with an optional label; either half may be an expression of the scene's parameters, so a marker rides a slider or a keyframe. Data-bound, lat and lon name columns and the one node draws every row; size-by scales each symbol's area with a column, the largest value at the marker's size, which makes a proportional-symbol map. A row whose size is zero or less draws nothing.
region:world{
    marker(lat: #quakes.lat; lon: #quakes.lon; size-by: #quakes.magnitude; colour: red; opacity: 0.6)
}#Great-circle routes
arc draws the great-circle route between two places, the shortest way over the earth. On a mercator map the London–Tokyo arc bends far north of the straight line between them. Either end may name a marker placed with at, and then follows it.
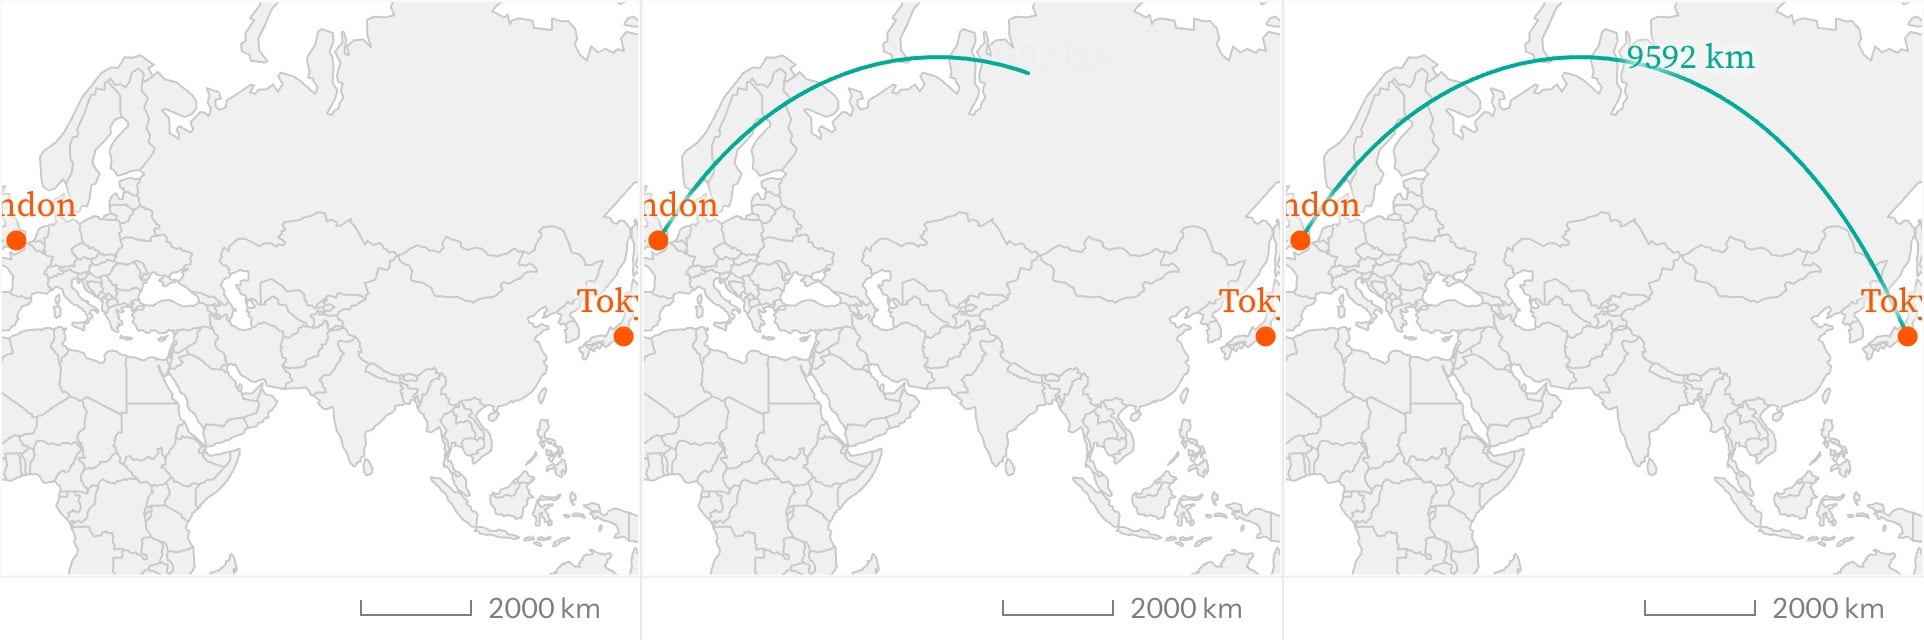
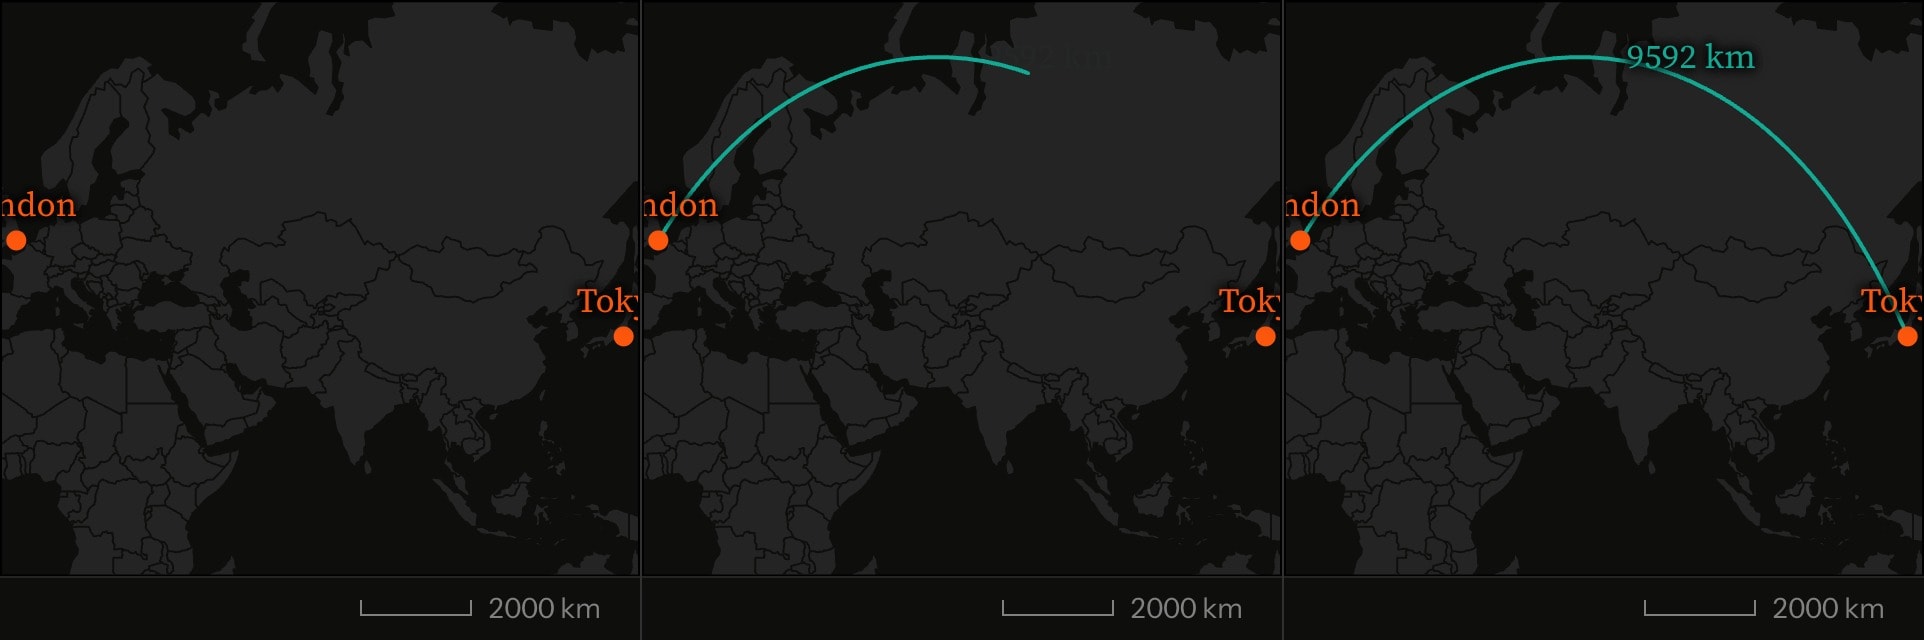
region:world{
    cue.draw{
        arc#route(from: #london; to: #tokyo; label: {{round(#route.length, 0)}} km)
    }(
        in: 1
        in-duration: 1200ms
    )
    marker#london(at: 51.47, -0.46; label: London)
    marker#tokyo(at: 35.55, 139.78; label: Tokyo)
}(
    projection: mercator
)#Moving a map through time
A map moves through its data in one of two ways, and the shape of the data decides which. For a handful of columns side by side, chain them: values is animatable, so #y1990.rate !cue.to{#y2000.rate}(at: 1) eases each region between its two readings.
range when you chain columns, or the scale is re-fitted every frame and the change hides itself.For long-format data, one row per region per year, a control whose column: is the year column takes its range, stops and format from the data, and a choropleth given slice on the same column reads itself against it, easing each region between the two readings either side of the control. As a cue.slider the scene runs the years itself from its anchor, on the step's own transport.
region:world{
    cue.slider#years:t(column: #rates.year; name: Year; at: 1; duration: 12s)
    choropleth(regions: #rates.country; values: #rates.rate; slice: #rates.year; range: [0, 220])
}
A slice column of names rather than years cannot be eased between, so its control is a selector, and the map shows the rows carrying the name the reader picked. With no control over its column, a sliced choropleth shows each region's first row.
#Derived values
Two overlays publish what they compute. A choropleth publishes min, max, mean and count over the regions its data covered, and an arc publishes length, in kilometres along the great circle. A control publishes value, the year or the name it stands on. Each is read on an overlay or control with an id, and not while it is hidden: #route.length in an attribute, {{#route.length}} in prose. The environment itself publishes area, the land its basemap draws in square kilometres, only: and except: applied. Derived attributes covers how they behave.
choropleth#gdp(…), then {{#gdp.max}}.#Attributes
basemapchoropleth inherits: world (Natural Earth 1:110m countries), us-states, canada-provinces, australia-states, uk-counties, nz-regions or europe-admin1; or #id naming an attached .geojson dataset, in: #wards. Normally written in the head, region:world. Without it nothing is drawn but the overlays.worldus-statescanada-provincesaustralia-statesuk-countiesnz-regionseurope-admin1region:valueonlyFrance, DEU and Côte d'Ivoire all read, and on world common names such as Ivory Coast too. The rest of the map is left as open ground, and a name that matches nothing draws nothing.exceptonly: names them: except: Antarctica.highlightonly: names them: they take fill: and stroke:, and the rest of the map stays plain land. highlight: France, Germany; fill: teal.fillcolourstrokefill: hue, and every other border is drawn as a seam of the page background.colourborder-widthstroke: paints.1name-property.geojson only: the feature property holding each region's name, which is what a choropleth joins on. Absent, the first of name, NAME, title or id the features carry.codes.geojson only: a feature property holding a short join code — the custom equivalent of a pack region's ISO alpha-3.simplify.geojson only: Douglas–Peucker tolerance in degrees, thinning boundary detail as the file is read. 0 keeps every point.0title$maths$ and inline formatting render.projectionequal-earth, the default, keeps areas true. mercator keeps angles true, and is the frame on which a great-circle arc visibly bends; it stops at 85° north and south. equirectangular plots latitude and longitude as a plain grid. conic is an equal-area conic whose standard parallels are set from the band of latitude the map frames, for one country or region. albers-usa is the United States composite: the lower 48 on an equal-area conic, with Alaska at 35% scale and Hawaii as insets. globe is the sphere seen from space, the far hemisphere behind the horizon.equal-earthmercatorequirectangularconicalbers-usaglobeequal-earthcentrecentre: 48.85, 2.35 — or #id naming a marker placed with at:, centre: #tokyo, so the place is stated once. Either half of a coordinate may be a parametised expression. Animatable: centre: 20, 0 !cue.to{50.5, 15}(at: 2; duration: 900ms) pans the frame, and a keyframe from one marker to another glides between them; the same anchor on zoom: makes the two move as one. Omitted, the map frames its own contents; on albers-usa, the lower 48.centerzoomequal-earth, mercator and equirectangular, 1 fits the world's width; on globe it fits the sphere, and on albers-usa the composite. Omitted, the map fits what it draws across every step — markers placed with at:, arc ends, the basemap when highlight:, only: or except: picks regions out, choropleth packs, keyframes included, but not data-bound markers; a single marker opens at 0.5. Parametised, and animatable with !cue.to.interactivefalseshow-scalescaletrueshow-graticulegraticulefalsegraticule-spacingshow-graticule.15continueregion environment whose reader camera this one starts from: continue: #that-environment. The camera carries only into an interactive environment, and the scene's parameters do not travel with it; every authored attribute is the new environment's own.#Derived attributes
Computed while the element renders — read one with #id.name in attribute position or {{#id.name}} in prose, never set.
areaonly: and except: applied, in square kilometres — each polygon's exterior less its holes, by the spherical line integral on the mean earth sphere; a dash until the boundary pack or file has loaded, or when the environment has no basemap:.#Allowed content
#Allowed in
#Examples
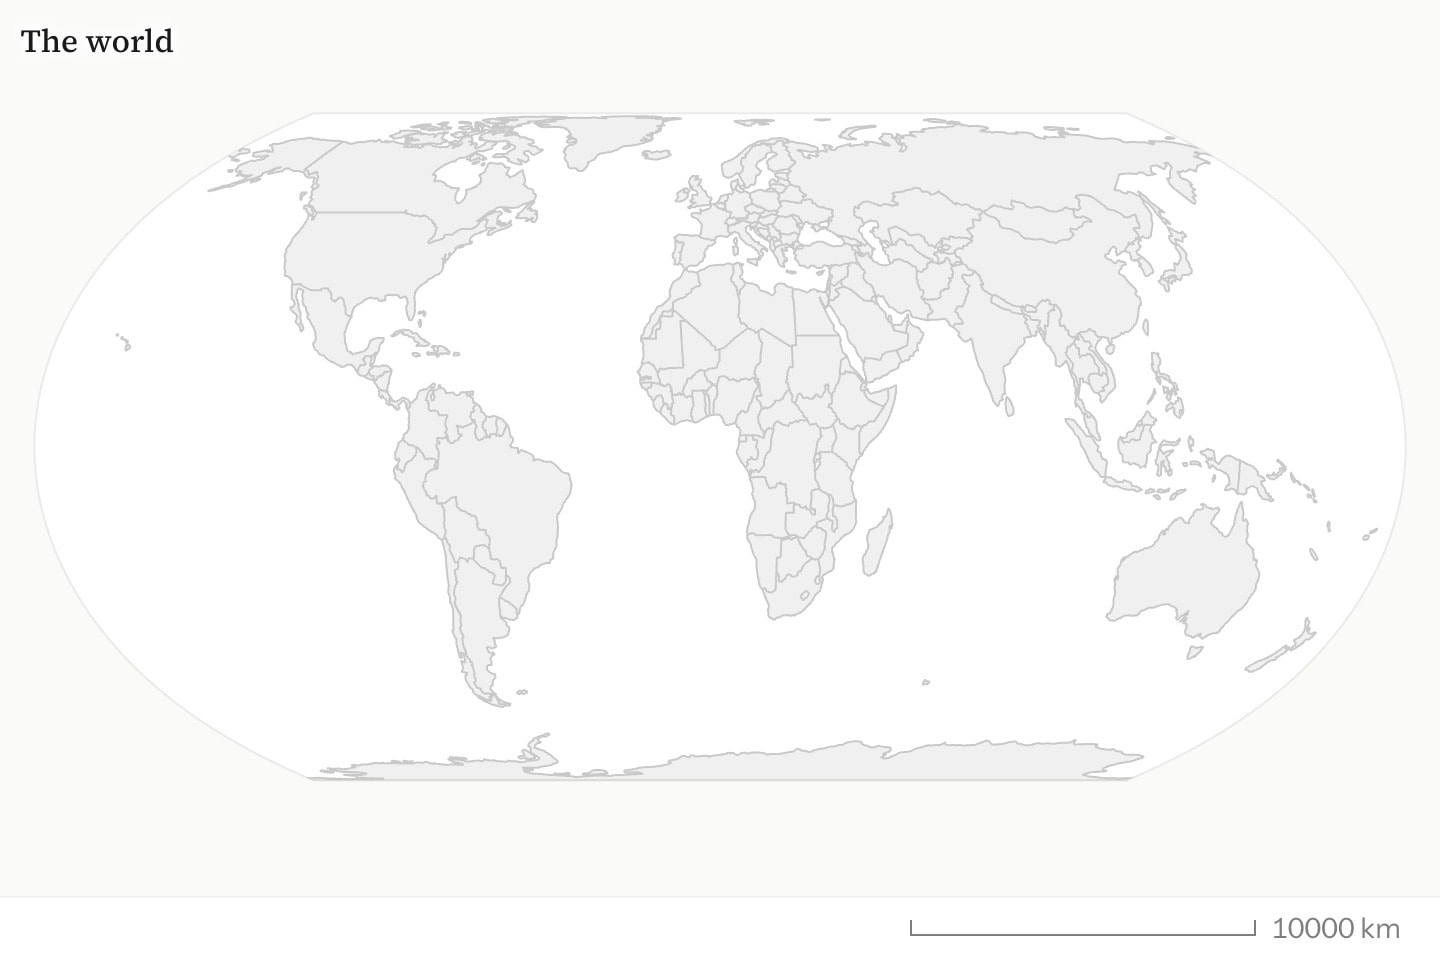
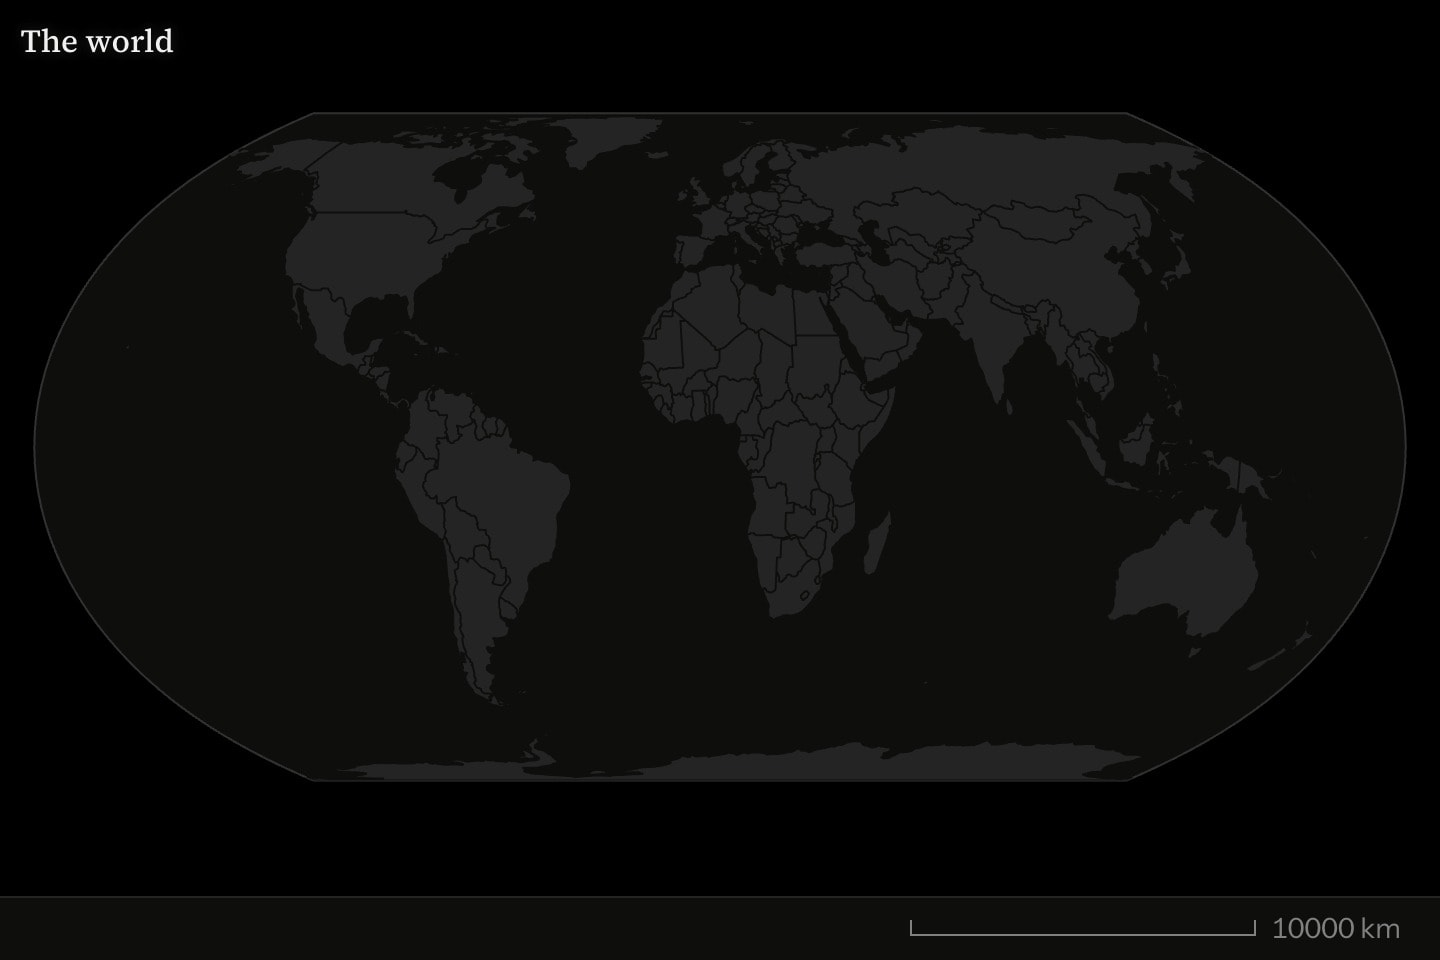
region:world(title: The world)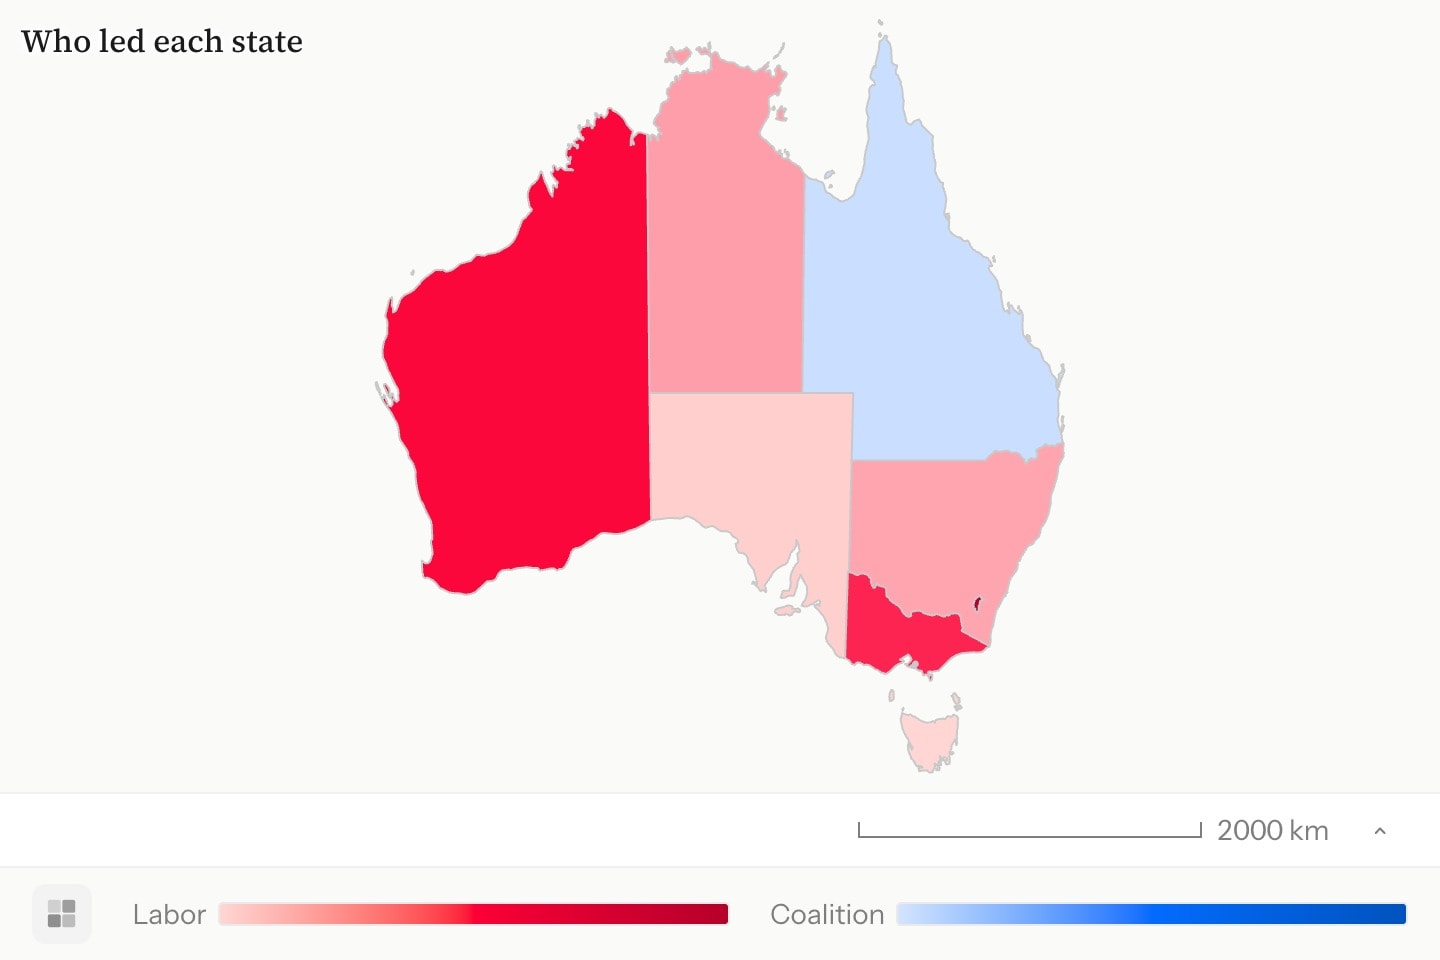
region:australia-states{
    choropleth(regions: #vote.state; values: #vote.margin; colours: #vote.colour; labels: #vote.party)
}(
    title: Who led each state
)
region:world{ }(
    projection: globe
    centre: -20, 135
)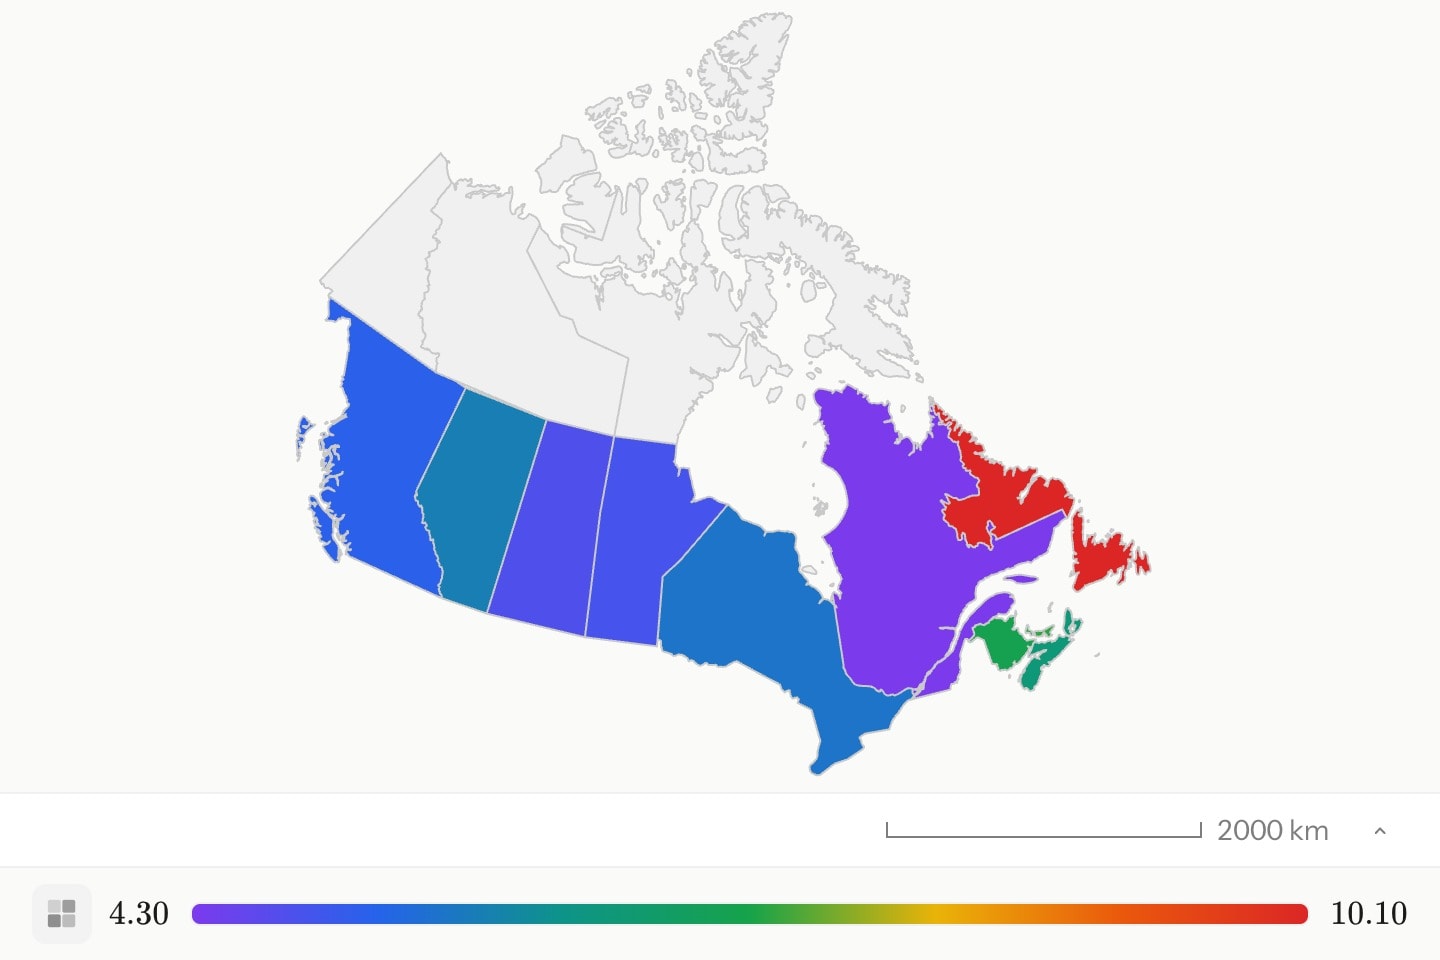
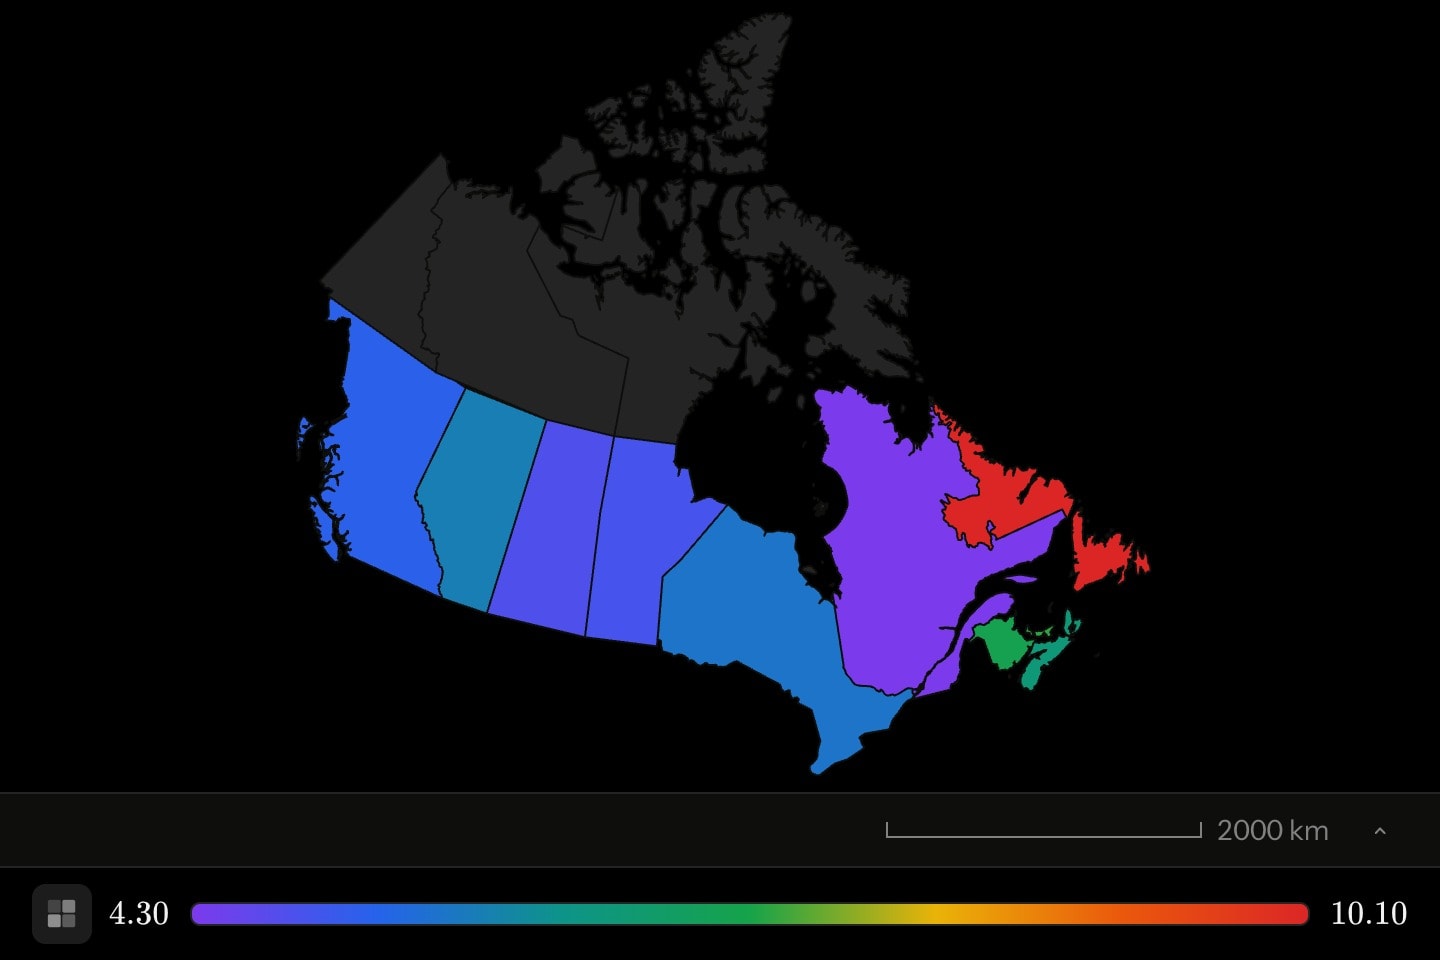
region:canada-provinces{
    choropleth(regions: #d.province; values: #d.rate)
}(
    projection: conic
)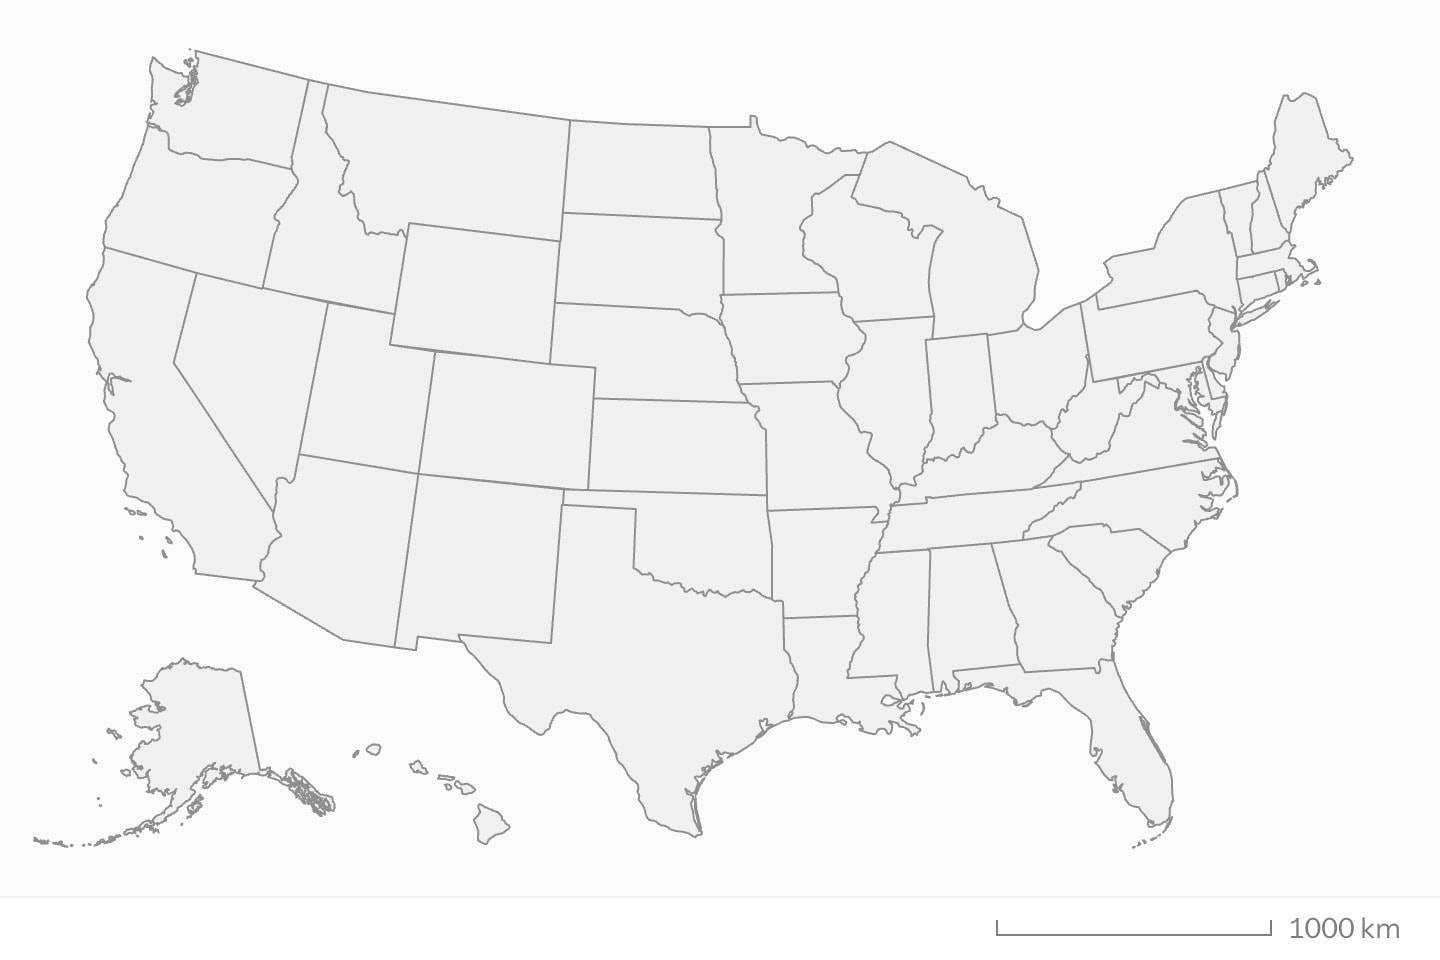
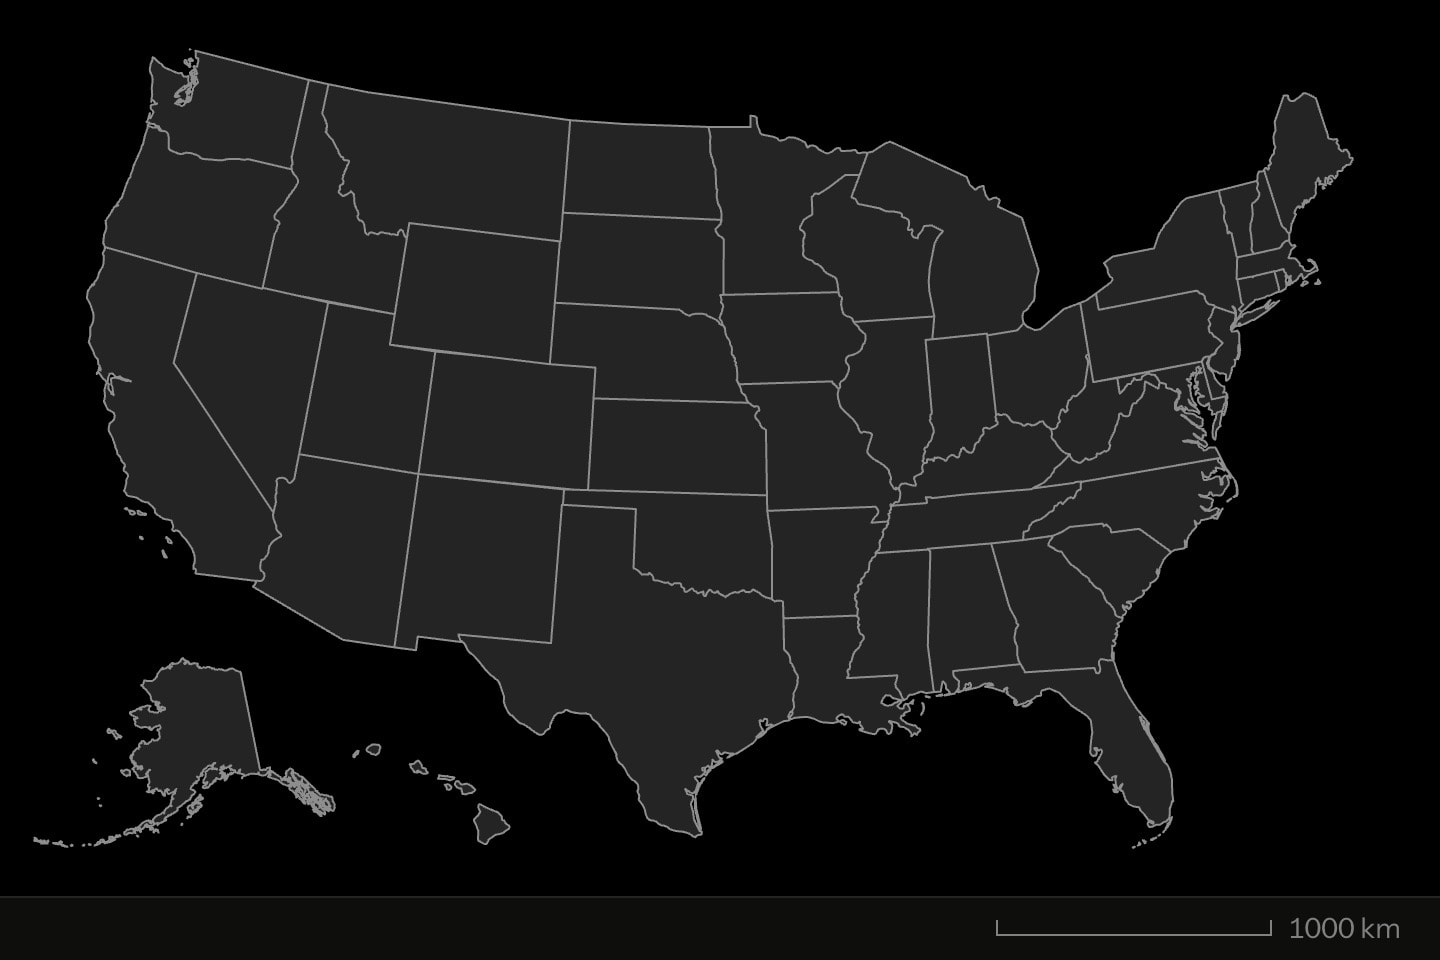
region:us-states(
    projection: albers-usa
    stroke: grey
)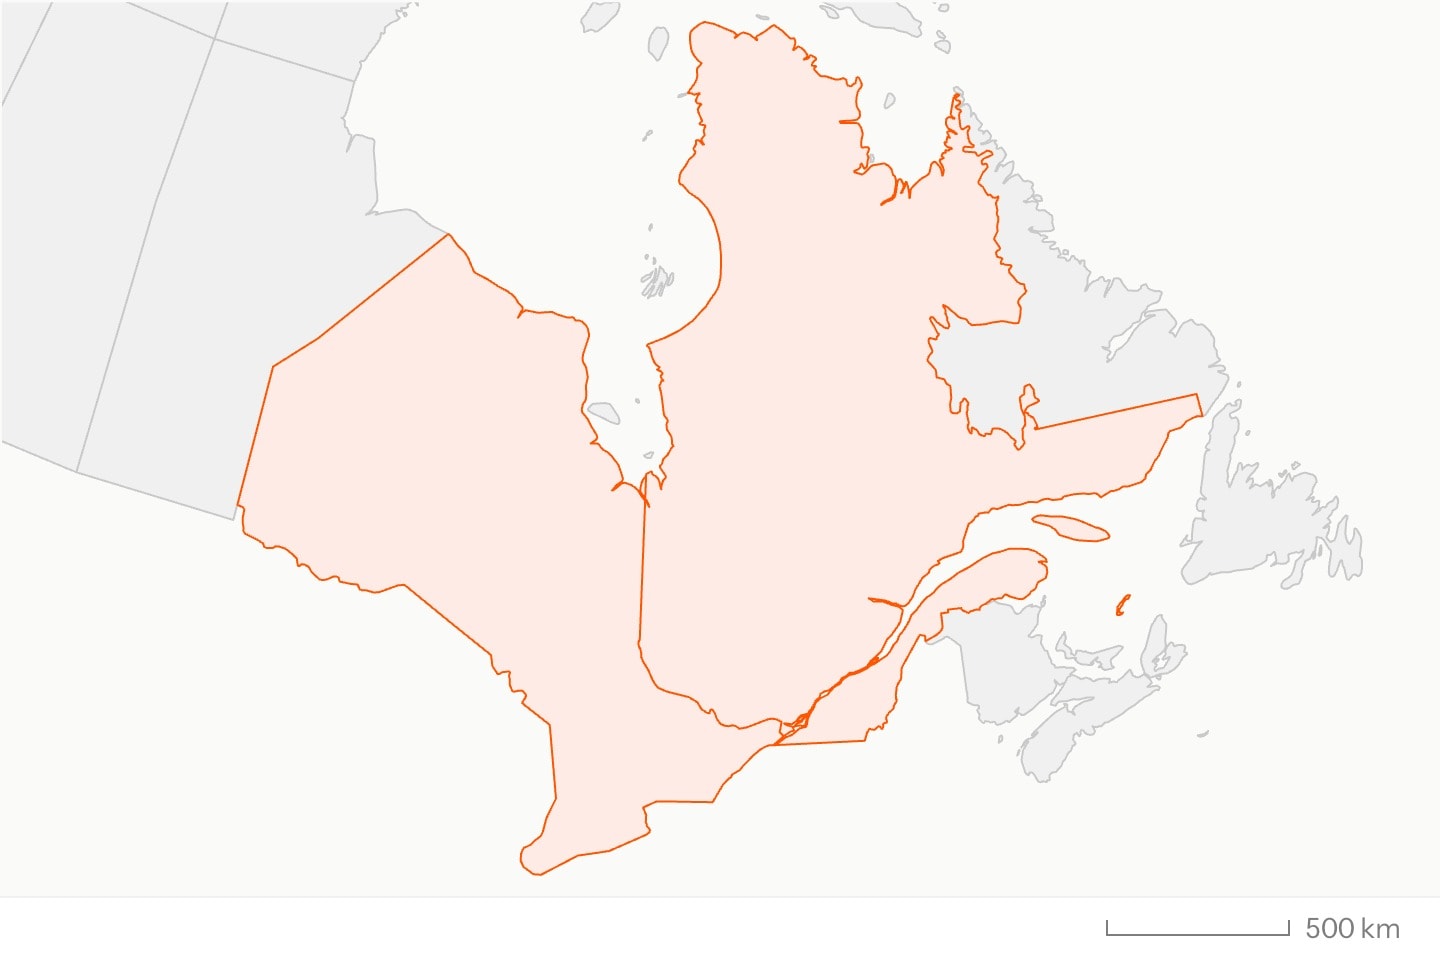
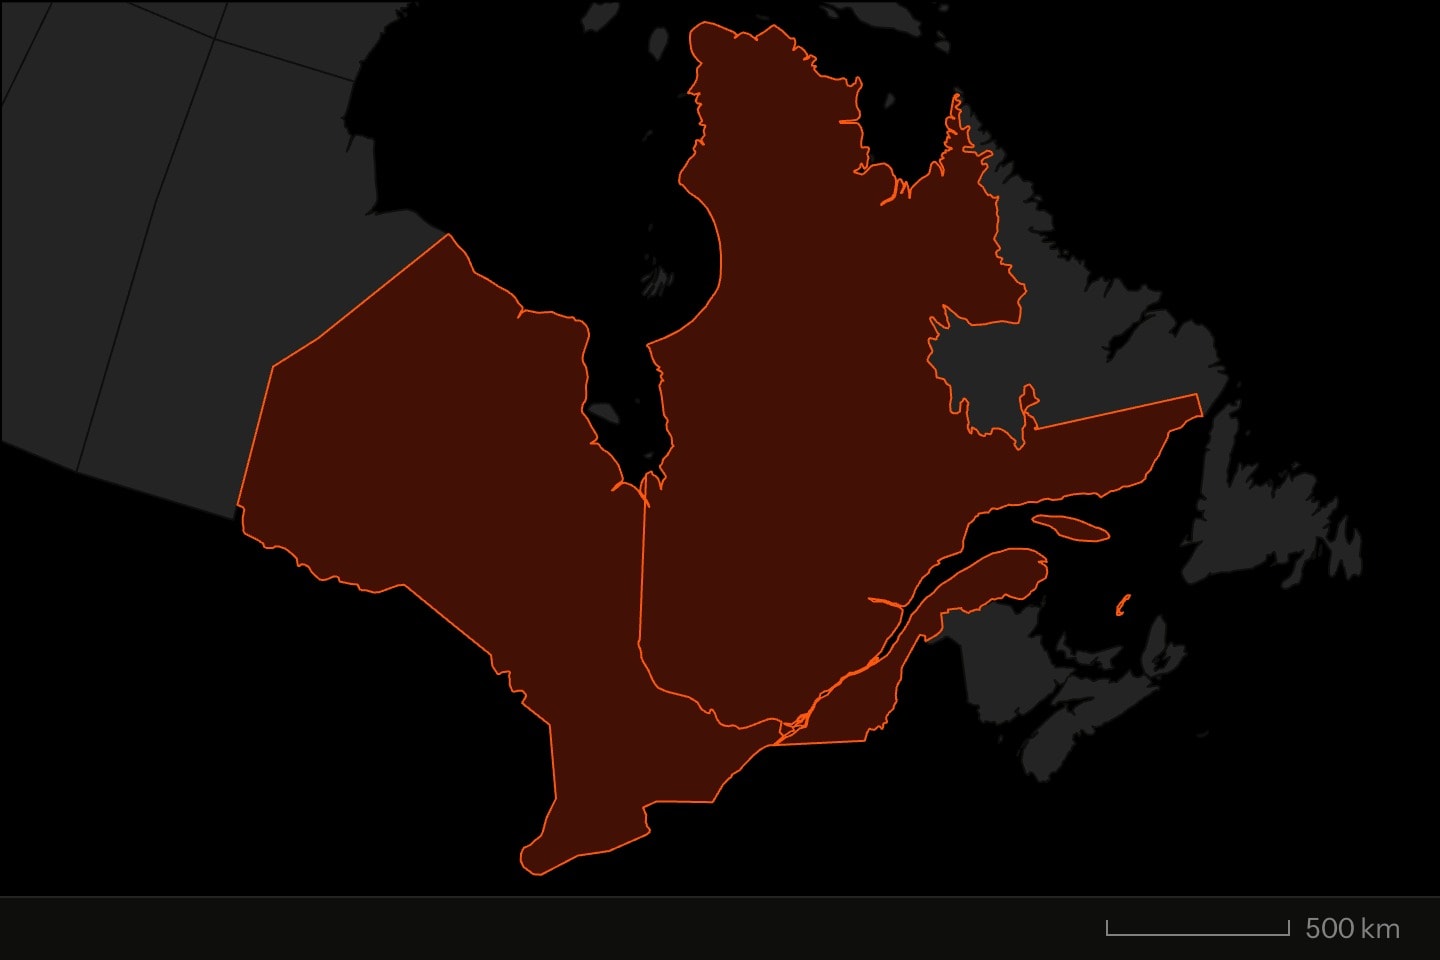
region:canada-provinces(
    projection: conic
    highlight: Quebec, Ontario
    fill: orange
)#Notes
- An environment's own id is written on the node —
region#europe{…}— andcontinue:points back at it with#europe. - Of the cues, a
regionbody takescueandcue.draw, which traces anarcalong its length;cue.highlightandcue.spotlightare refused. - There is no boundary node, so a map has one set of boundaries; data on a second pack is a
choroplethwith its ownbasemap:. - The cursor's coordinates, and the name of the region beneath it, read out at the start of the footer; the scale bar sits at its end.
#Writing guidance
- Selecting canvas content — A mark belongs on the canvas when seeing it changes what the reader understands, and the detail holds as a picture on its own.