integral
The area under a curve between two values, shaded. of: takes #bell for a curve in the same environment or an expression to shade directly, and the region is sampled from the curve itself, so it follows an animated expression and a parameter driving either limit. The region closes along the axis: what is shaded is the area between the curve and y = 0, and where the curve dips below the axis the shading follows it down.
integralxyplane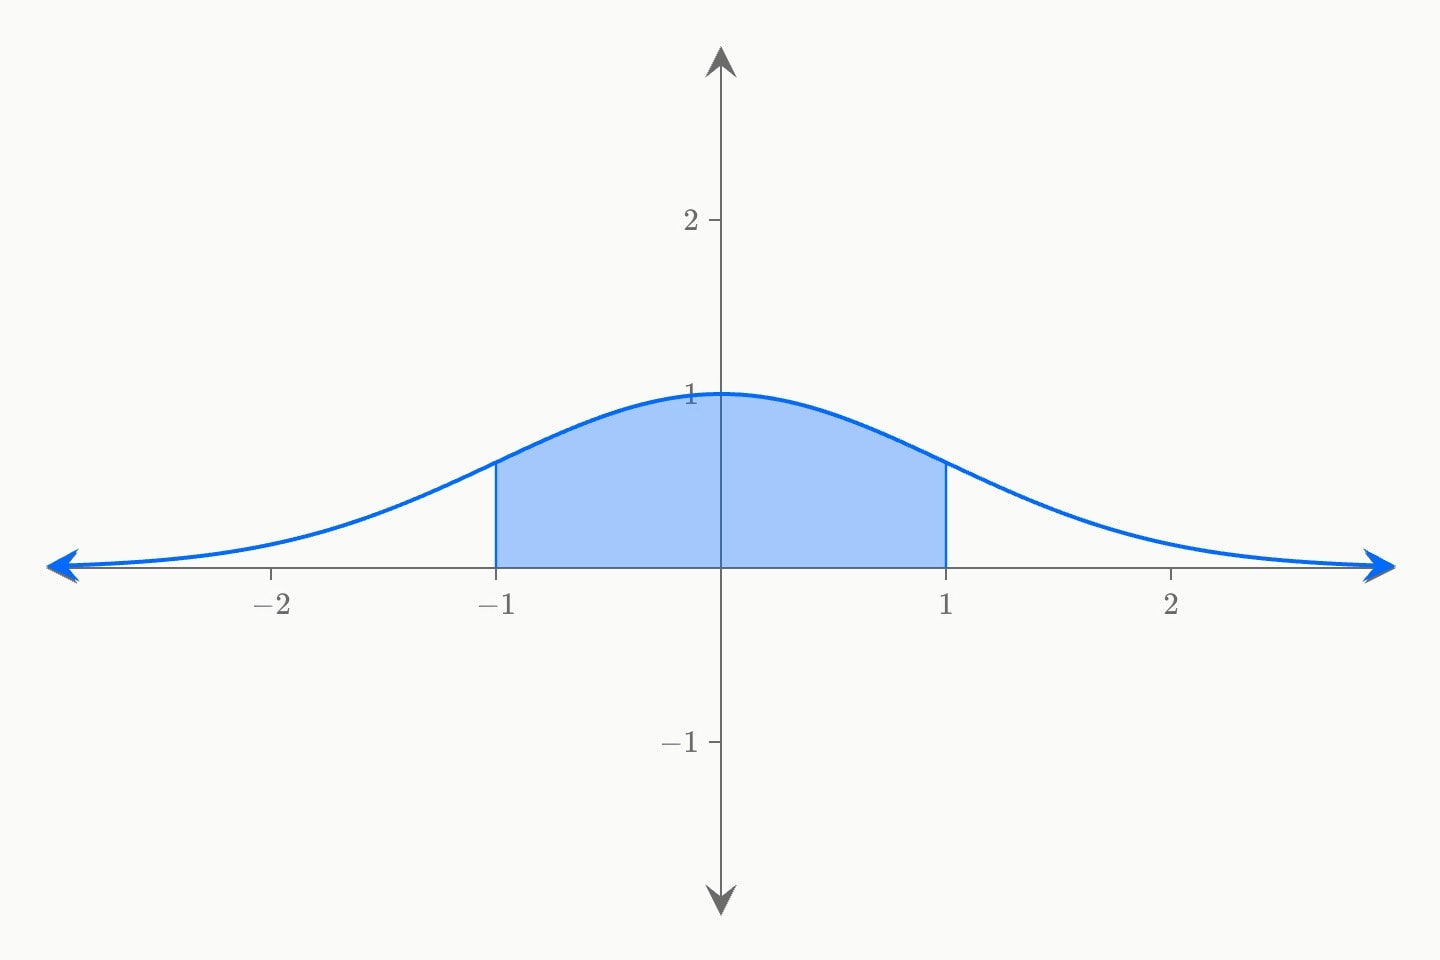
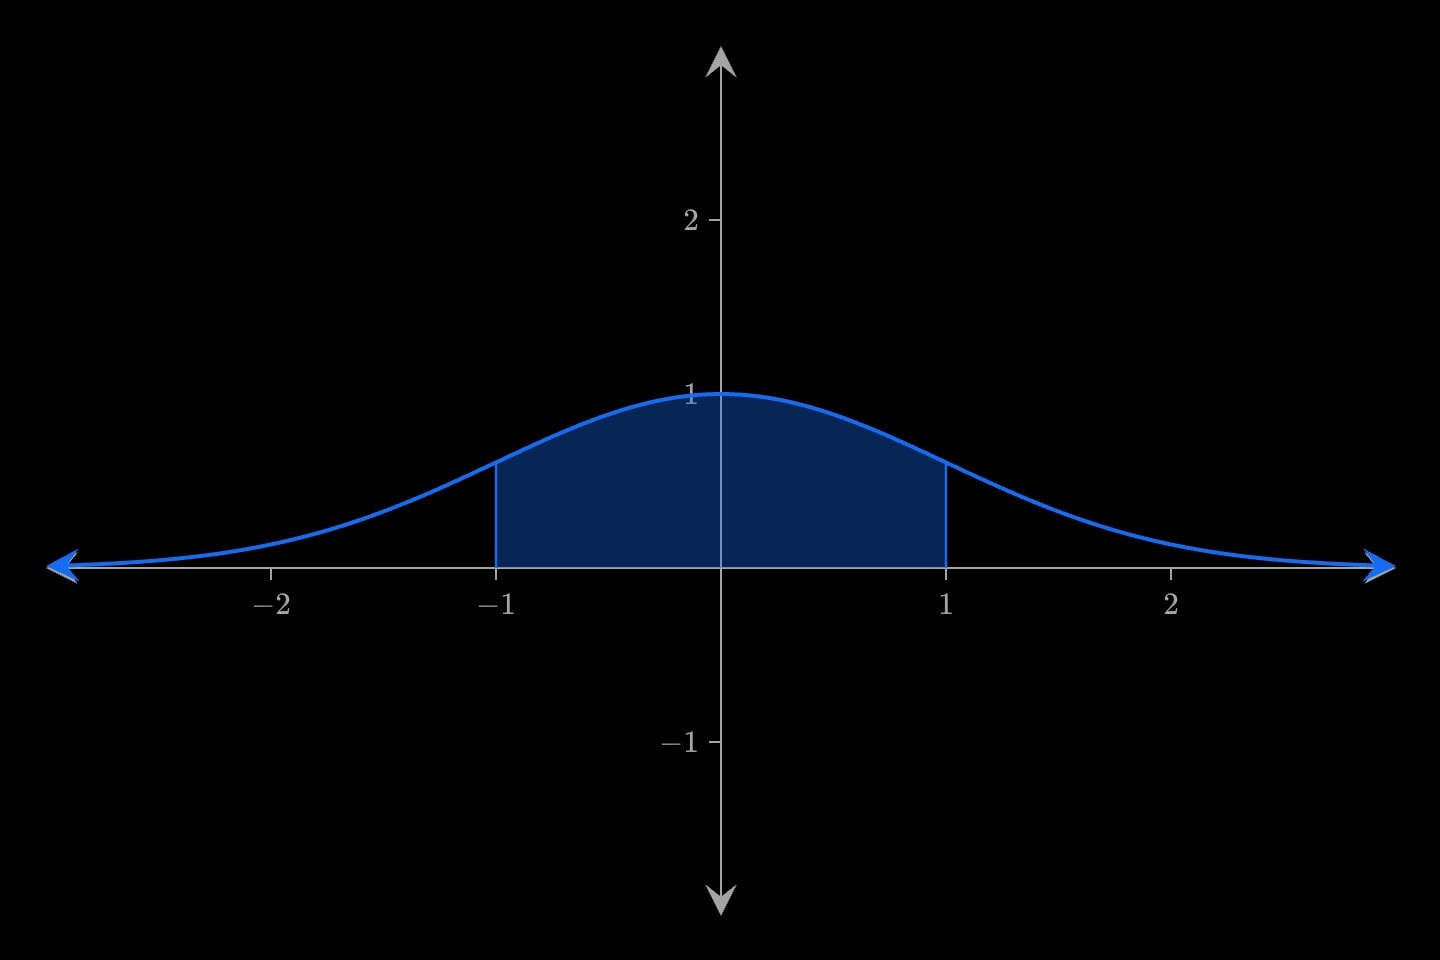
An integral shades the area under a referenced curve between two bounds — integral(of: #bell; from: -1; to: 1) — and exposes the computed area as derived value. Its bounds may be expressions, so a parameter can sweep the region while the reader watches the value change.
base says what the area closes down to: the axis, unless it names another curve (base: #demand) or an expression of its own — base: 6 shades down to that height. The area between two curves is not a mark of its own because it is not an idea of its own, and the reported value follows the floor. A region a parametric curve encloses is that curve's fill instead.
#Attributes
of#id for a curve in this environment, or an expression shaded directly.curve, underCan be written as shorthand: integral:valuefroma, starttob, endbasebase: #demand) or an expression of its own, and a number is one (base: 6 shades down to that height). The area between two curves is not a special mark, because it is not a special idea: an integral is the region between a function and a floor, and y = 0 is only the floor nothing else was named. The reported value follows, so with a base it is the area BETWEEN.down-to, floorcolourbluelight-bluedark-blueredlight-reddark-redorangelight-orangedark-orangeyellowlight-yellowdark-yellowteallight-tealdark-tealgreenlight-greendark-greenpinklight-pinkdark-pinkpurplelight-purpledark-purplegreylight-greydark-greyneutralhex(…)rgb(…)colorblueopacity0.35edgestruelabel$maths$ renders.hiddenfalselocklockedfalselayerz: before the argand plane took that letter for its coordinate.#Derived attributes
Computed while the element renders — read one with #id.name in attribute position or {{#id.name}} in prose, never set.
value{{#id.value}} and a probability label can never drift from the drawing.#Allowed in
#Examples
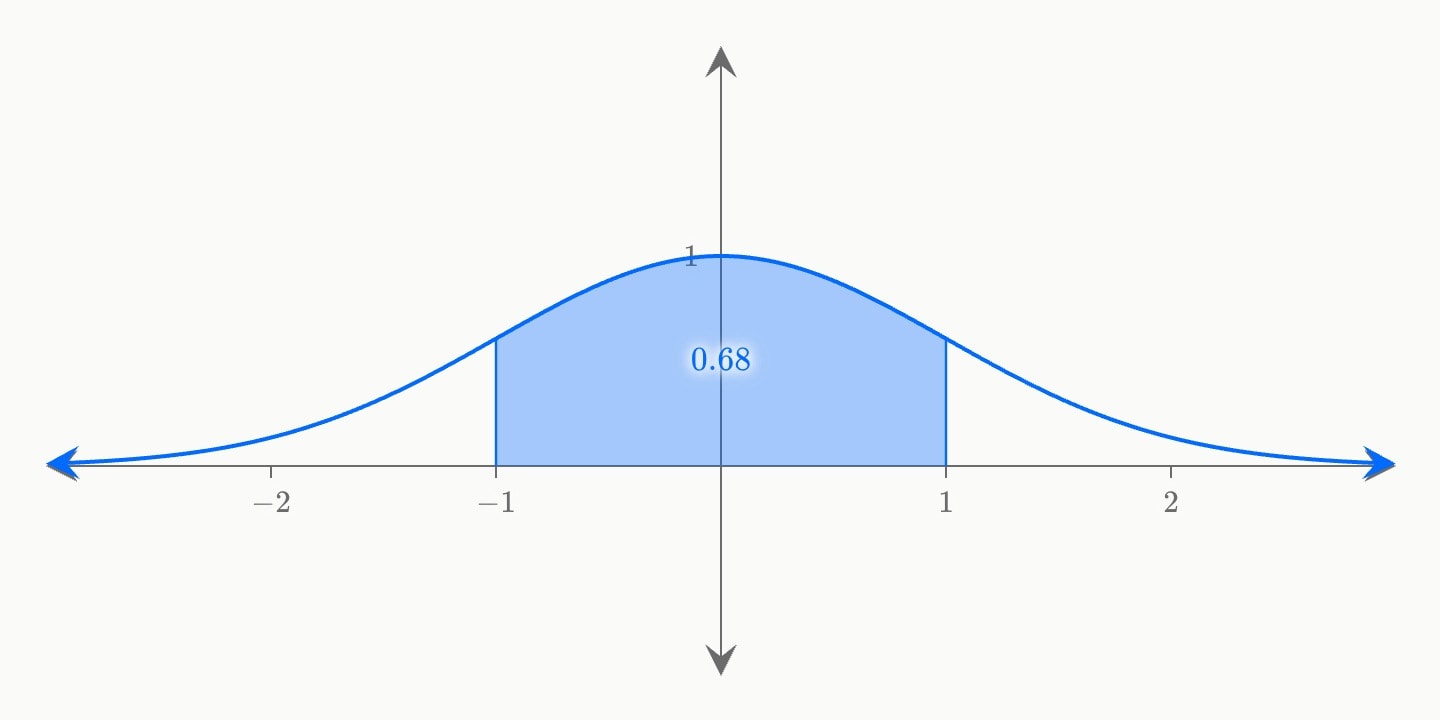
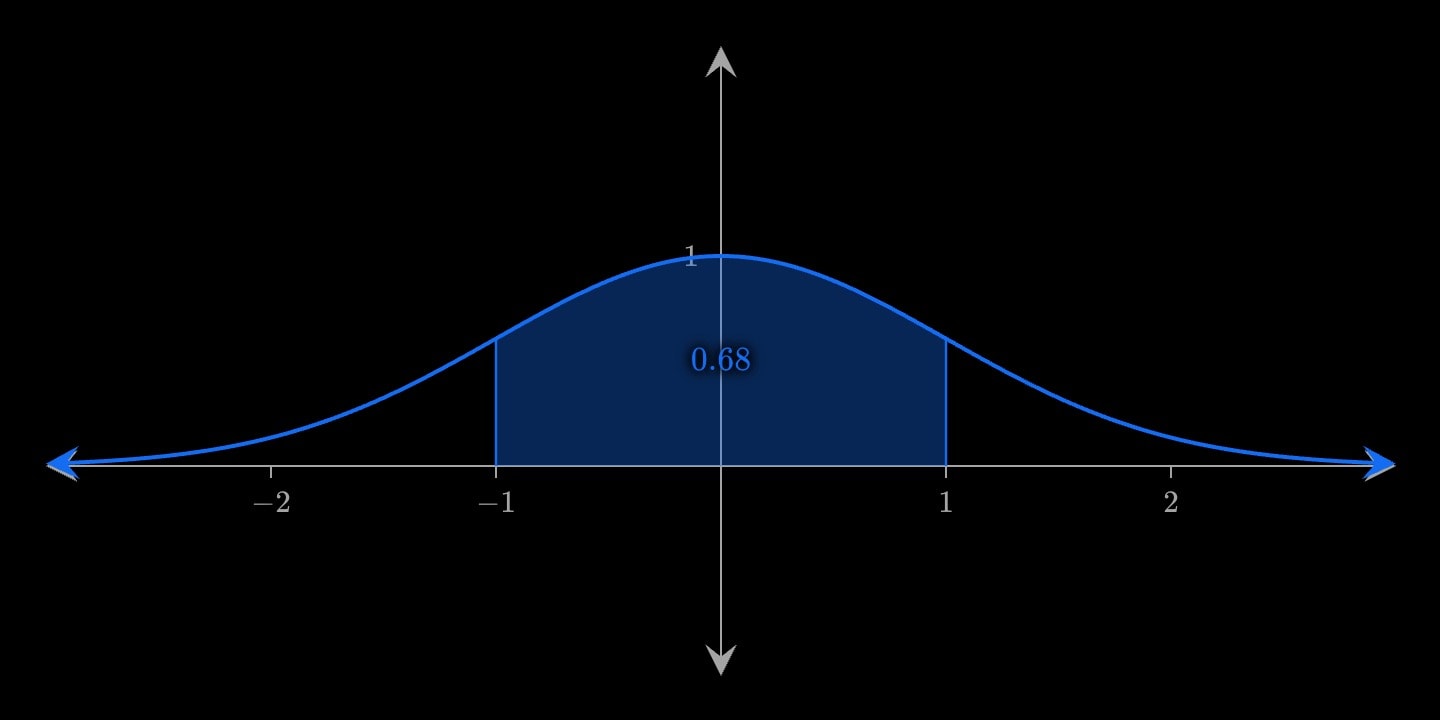
canvas.graph{
    curve#bell(expression: exp(-x^2 / 2))
    integral(of: #bell; from: -1; to: 1; label: $0.68$)
}(
    x-domain: [-3, 3]
)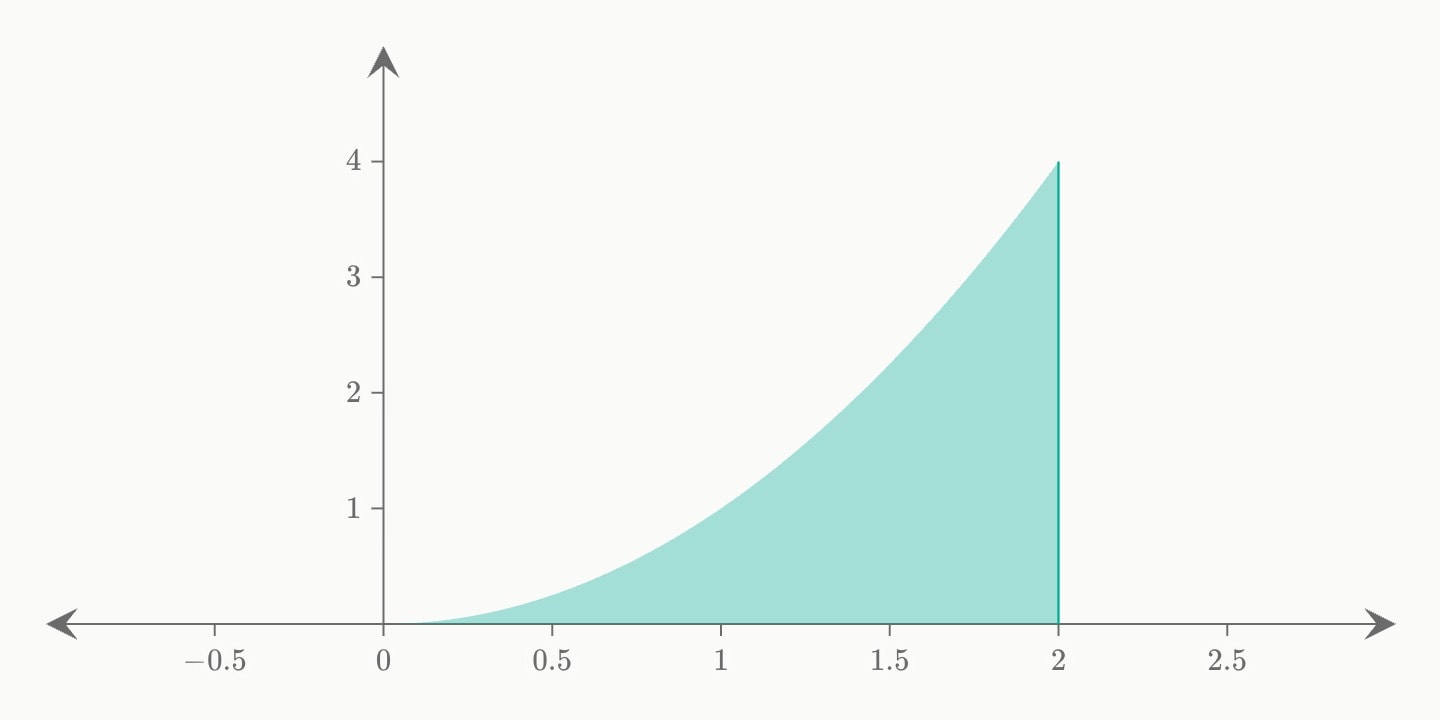
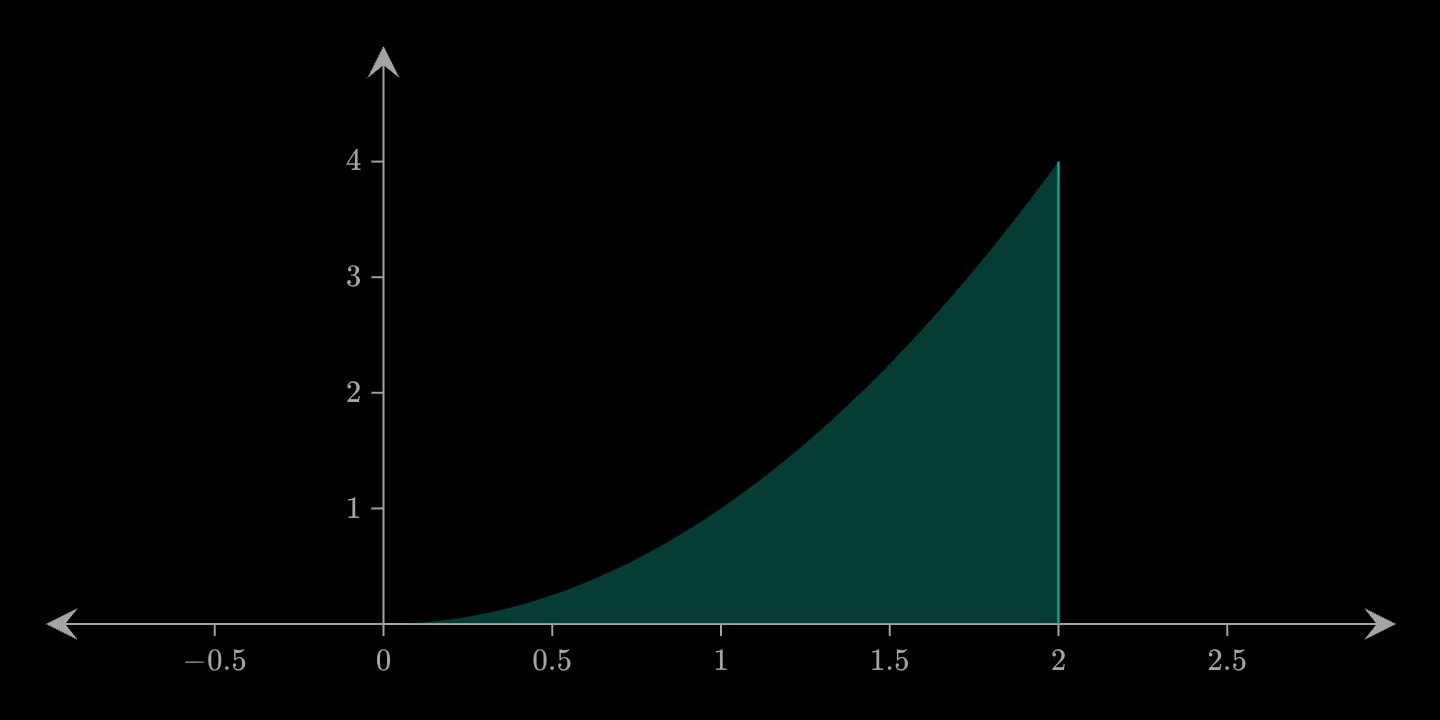
canvas.graph{
    integral(of: x^2; from: 0; to: 2; colour: teal)
}(
    x-domain: [-1, 3]
    y-domain: [0, 5]
)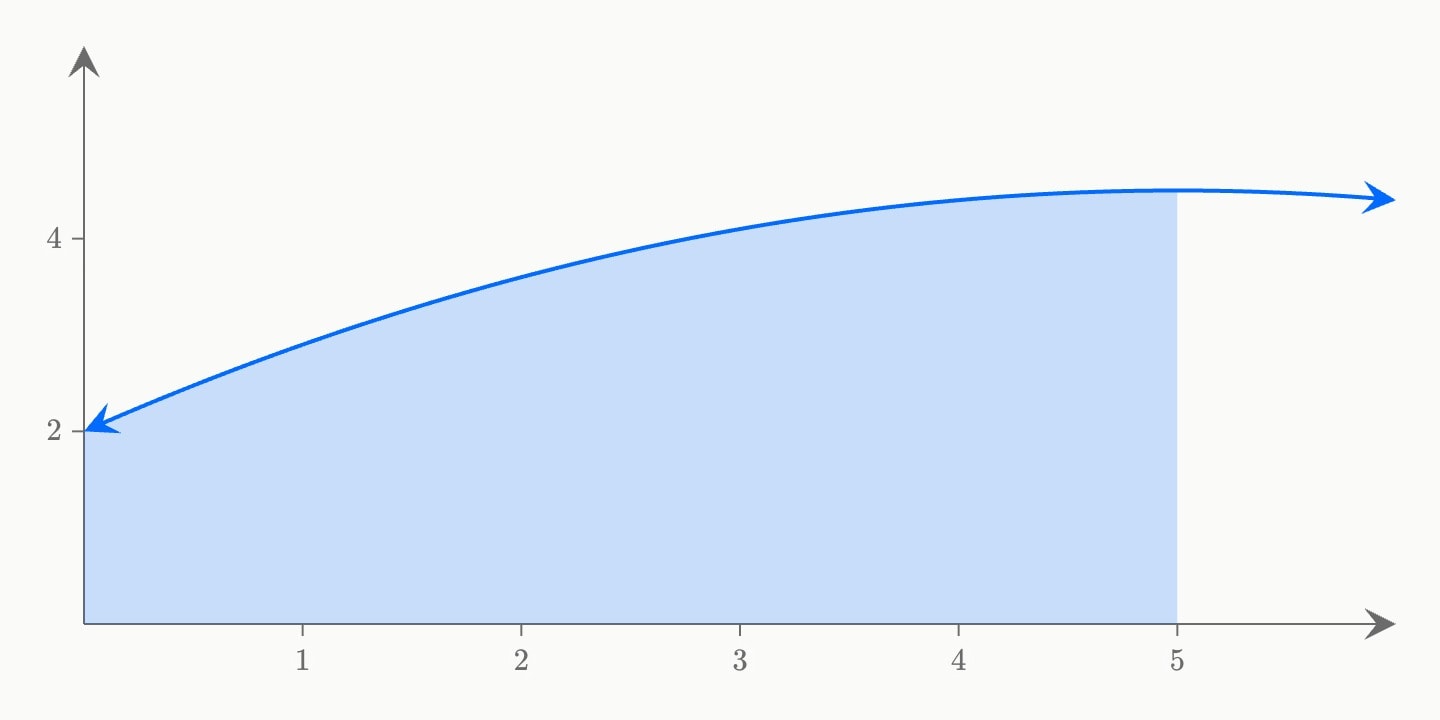
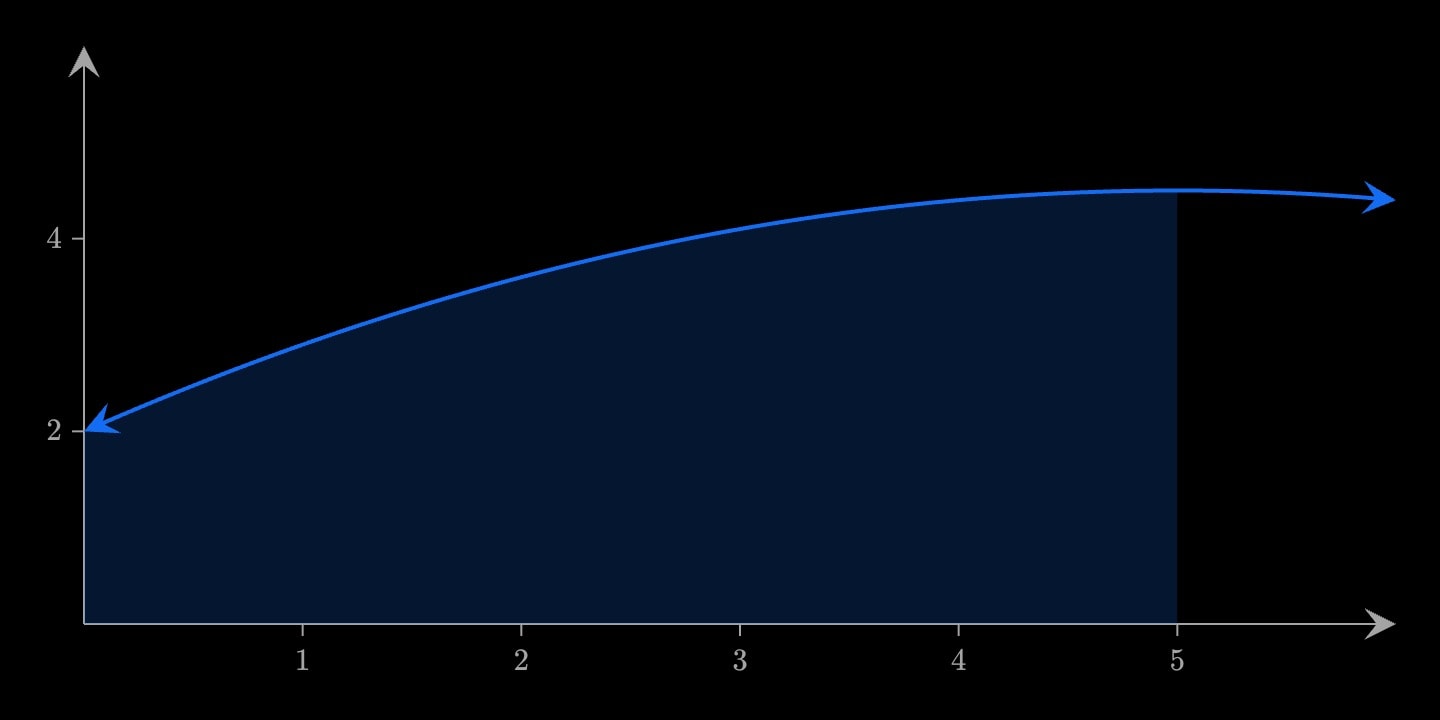
canvas.graph{
    curve#velocity(expression: 2 + x - x^2 / 10)
    integral(of: #velocity; a: 0; b: 5; edges: false; opacity: 0.2)
}(
    x-domain: [0, 6]
    y-domain: [0, 6]
)