histogram
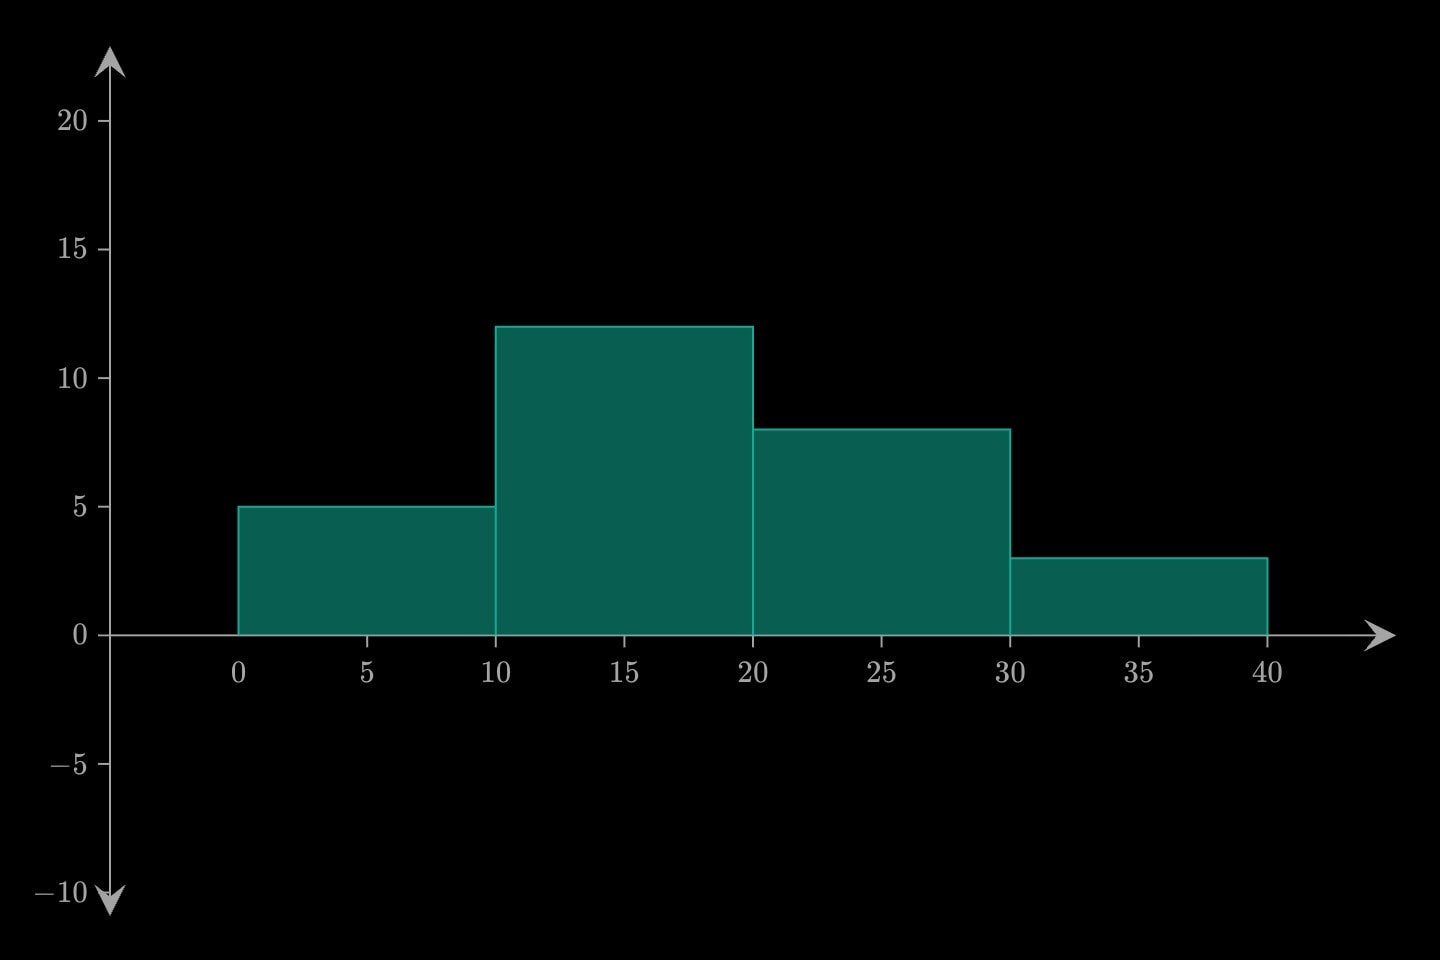
A sample drawn as bars over the values it takes. Written two ways: the READINGS, which the mark bins itself — histogram(x: #sample.height; bins: 12), where bins is how many — or the counts of an already-tallied sample in values, with bins the edges they fall between (one more number than there are counts). Which coordinate carries the readings is the axis the bins land on, and so which way the bars grow; orientation says the same thing for the counts form. Bars meet at their shared edges, take a colour each, and can print their value.
histogramxypolarplane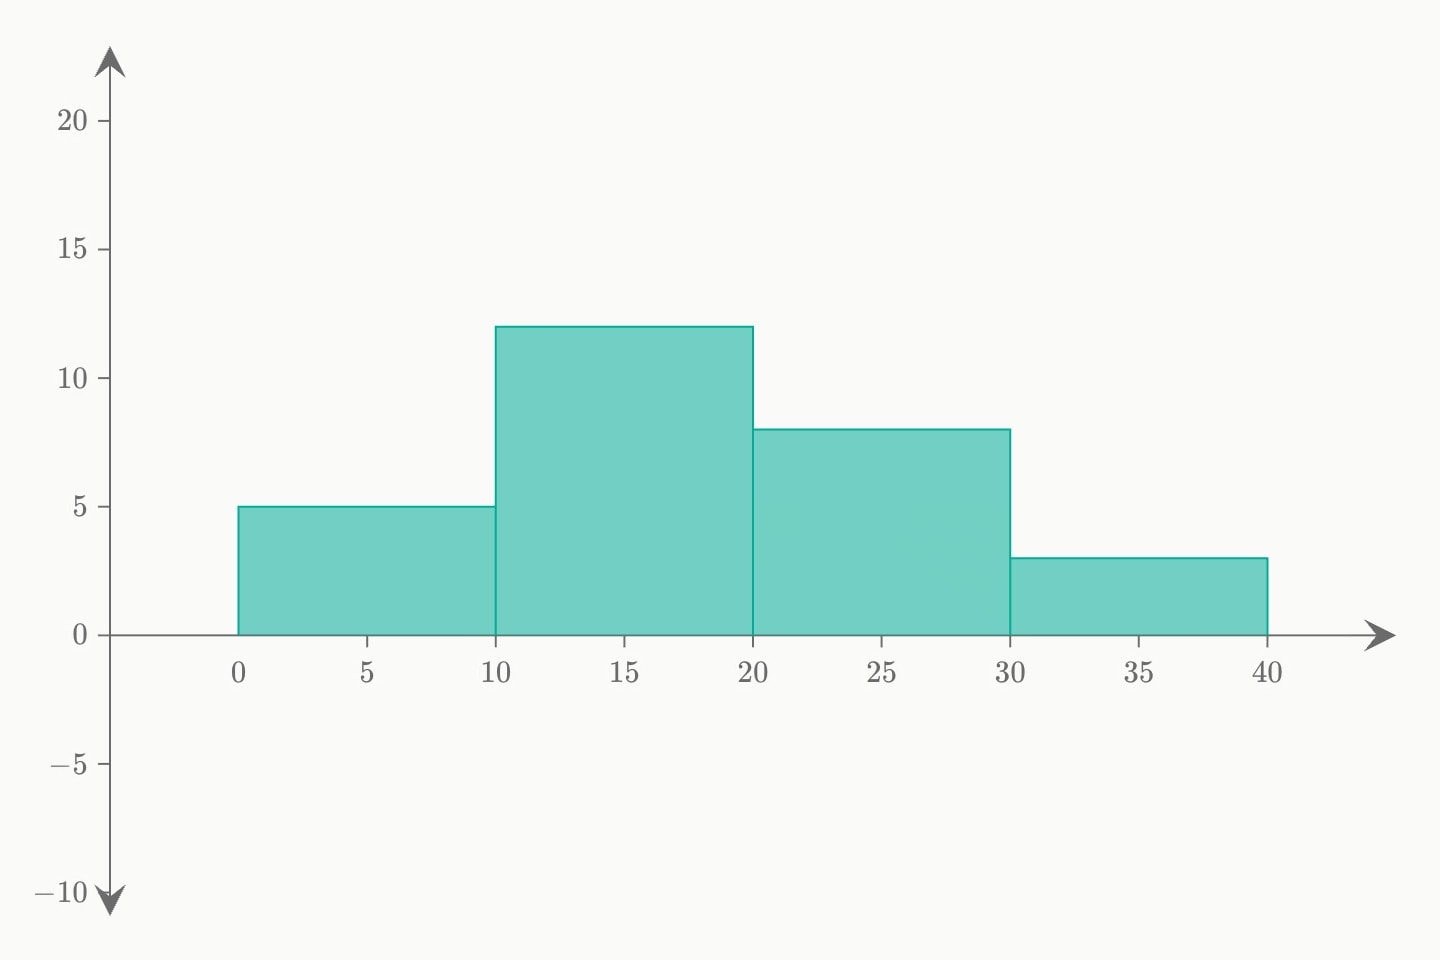
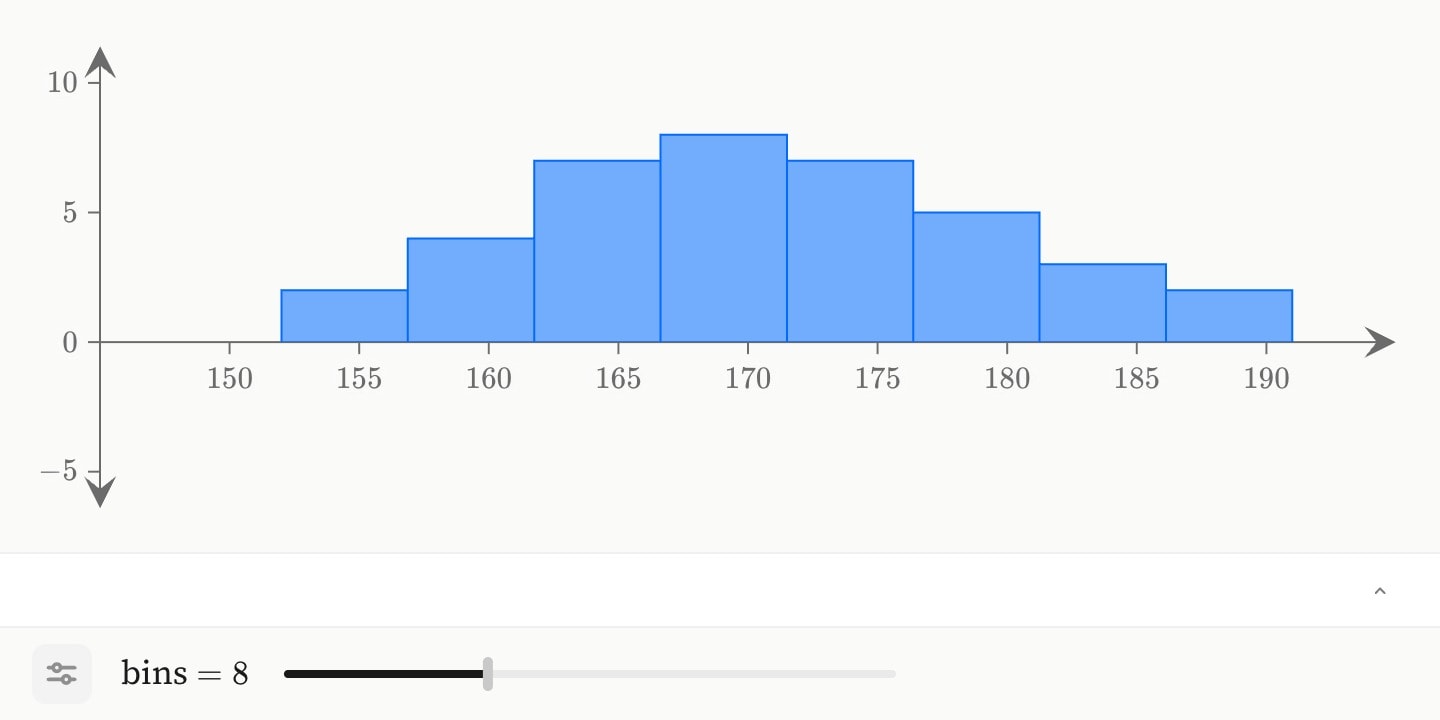
A histogram is a rectangle mark and a different thing from a bar: its bins are edges, so its width is data, and it draws on a numeric axis. It takes the readings themselves — histogram(x: #sample.height; bins: 12) — and bins them, bins saying how many; parametised (bins: k) the reader re-bins the sample for themselves, which is the quickest way to see how much of the shape was the choice of grid.
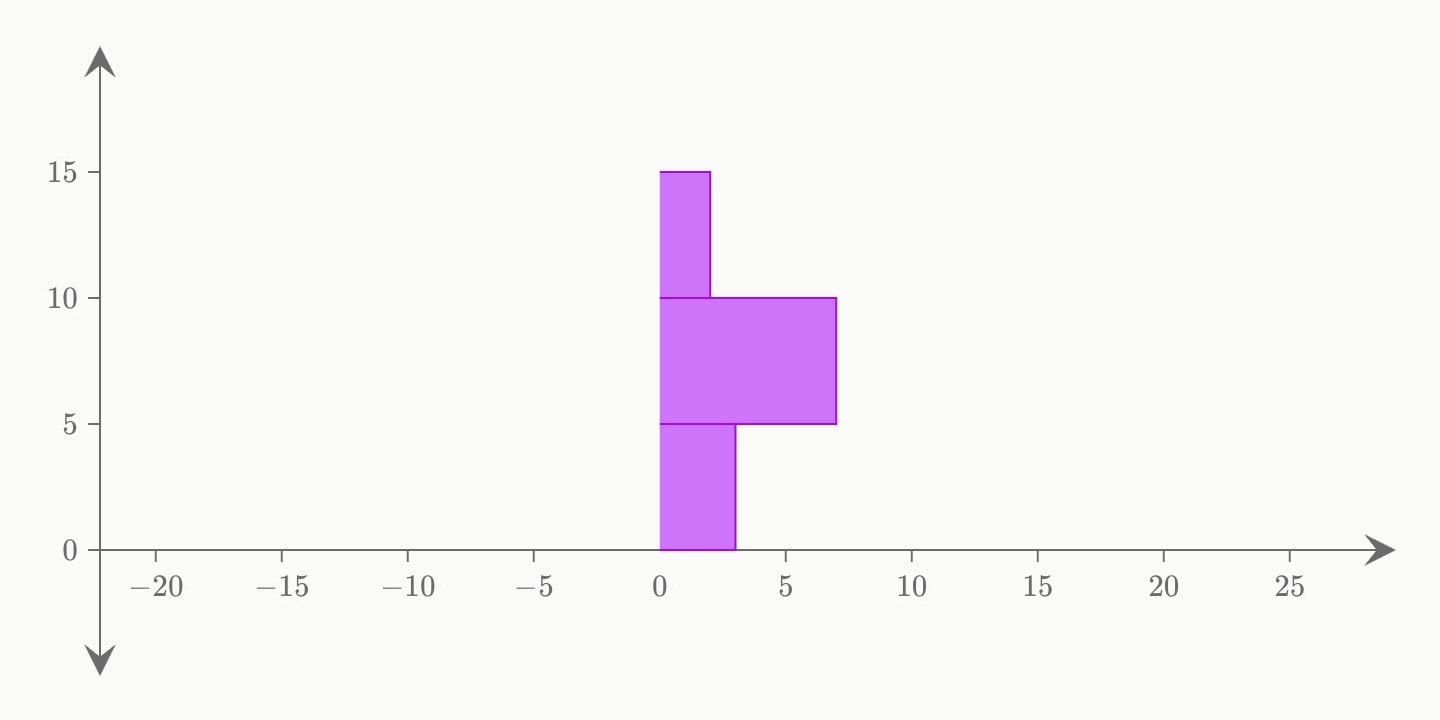
The coordinate the readings are written on is the axis the bins land on and so which way the bars grow (x up from the x axis, y out from the y axis, theta a wind rose on the polar plane, its bins edges on theta). A sample already tallied is written the other way instead — values the counts and bins the edges they fall between, one more number than there are counts, with orientation for the direction no coordinate is there to say.
#Attributes
valuesbins is then the edges they fall between, one more number than there are counts. Never beside readings: a histogram is given the counts or works them out, not both. e.g. 5, 12, 8histogram:valuebinsbins: 12, or parametised, bins: k, so a slider re-bins the sample — and it needs readings to bin. Two or more numbers are the edges themselves, in order, one more than there are bars, and may be unequal (0, 10, 20, 30). Computed bins span the sample exactly, smallest reading to largest; with no bins at all the count is the square root of the sample size.colourscolors, colour, colorblueorientationx or y — and that is the direction, so this says nothing beside them.verticalhorizontalverticalshow-labelsfalselabel$maths$ and inline formatting render. Fades and draws with the element.hiddenhidden: true !cue.to{false}(at: 2) reveals it — and unlike a cue, a hidden element still frames the plot, so the axes do not jump when it appears.falselockeditable: graph. Nothing at all on a graph that is not editable.lockedfalsetext-size20layerz: before the argand plane took that letter for its coordinate.xyplanexscatter takes one: numbers, or a dataset column (#sample.height). The mark bins them; bins says how many. Written on x, the grid lies along x and the bars stand up from it.yorientation is not written beside it.polarplanethetabins sectors and each count reaches out from the centre — a rose of the sample rather than of counts written by hand.#Allowed in
#Examples
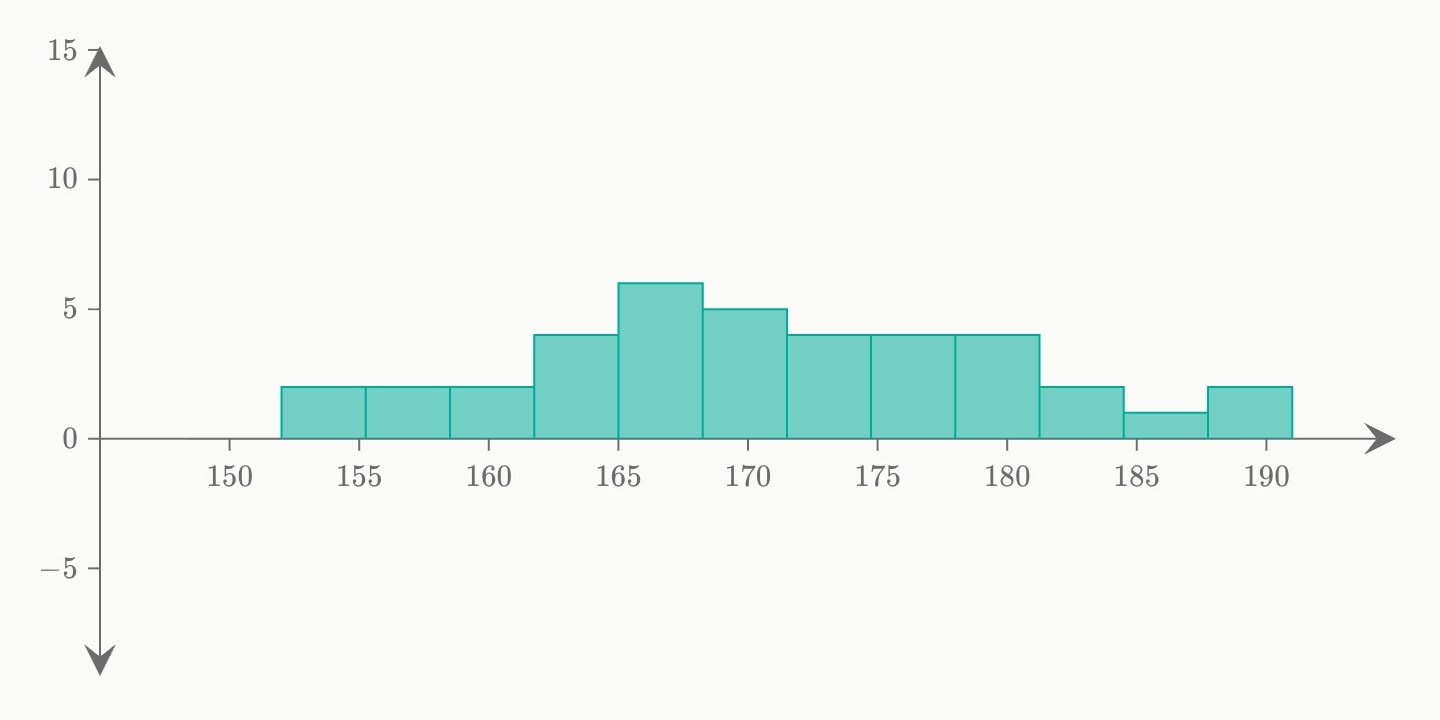
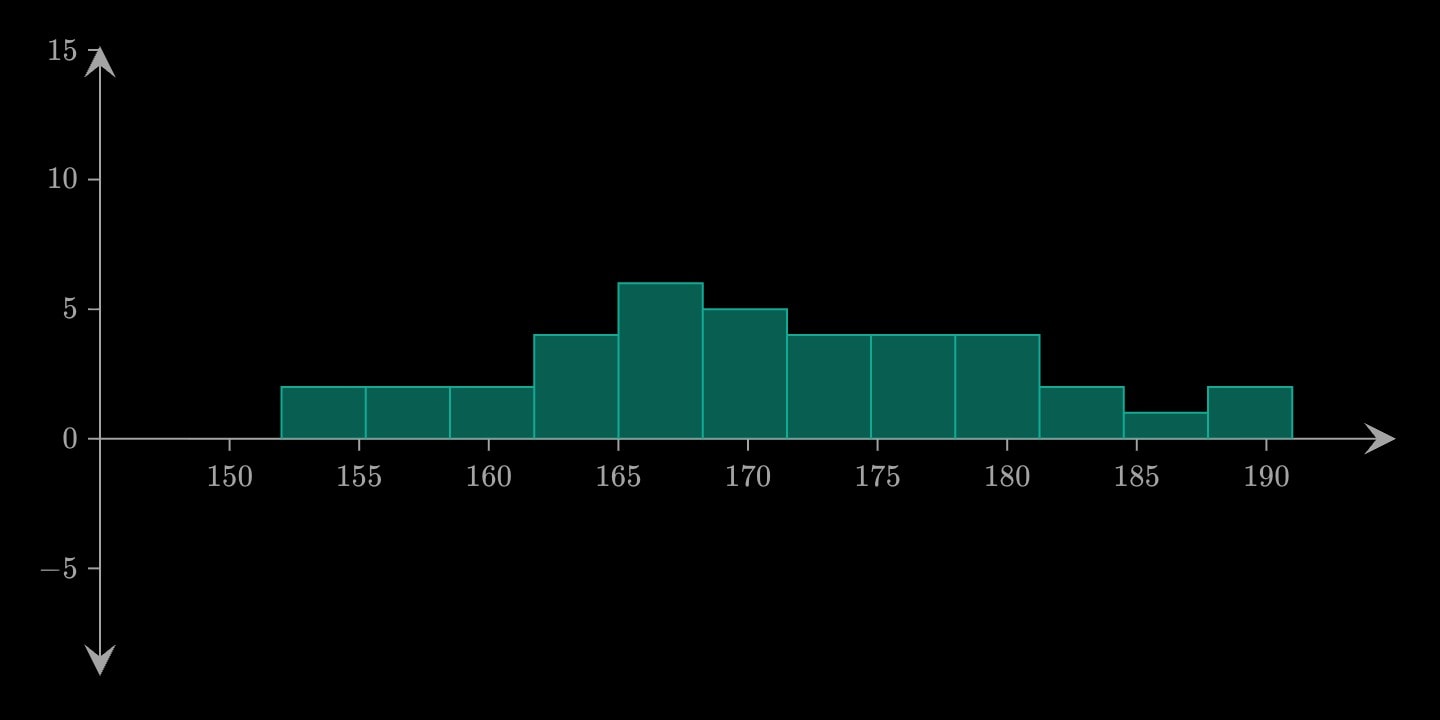
canvas.graph{
    histogram(
        x: #sample.height
        bins: 12
        colour: teal
    )
}
canvas.graph{
    slider:k(name: bins; range: [2, 20]; step: 1; default: 8)
    histogram(
        x: #sample.height
        bins: k
    )
}
canvas.graph{
    histogram(
        bins: 0, 5, 10, 15
        values: 3, 7, 2
        orientation: horizontal
        colour: purple
    )
}