residuals
Dashed drops from each of a fit's own observations to the fitted curve. of: names the fit; omitted, it takes the graph's only fit, and a graph with more than one has to be told which.
residualsOnly with
xyplane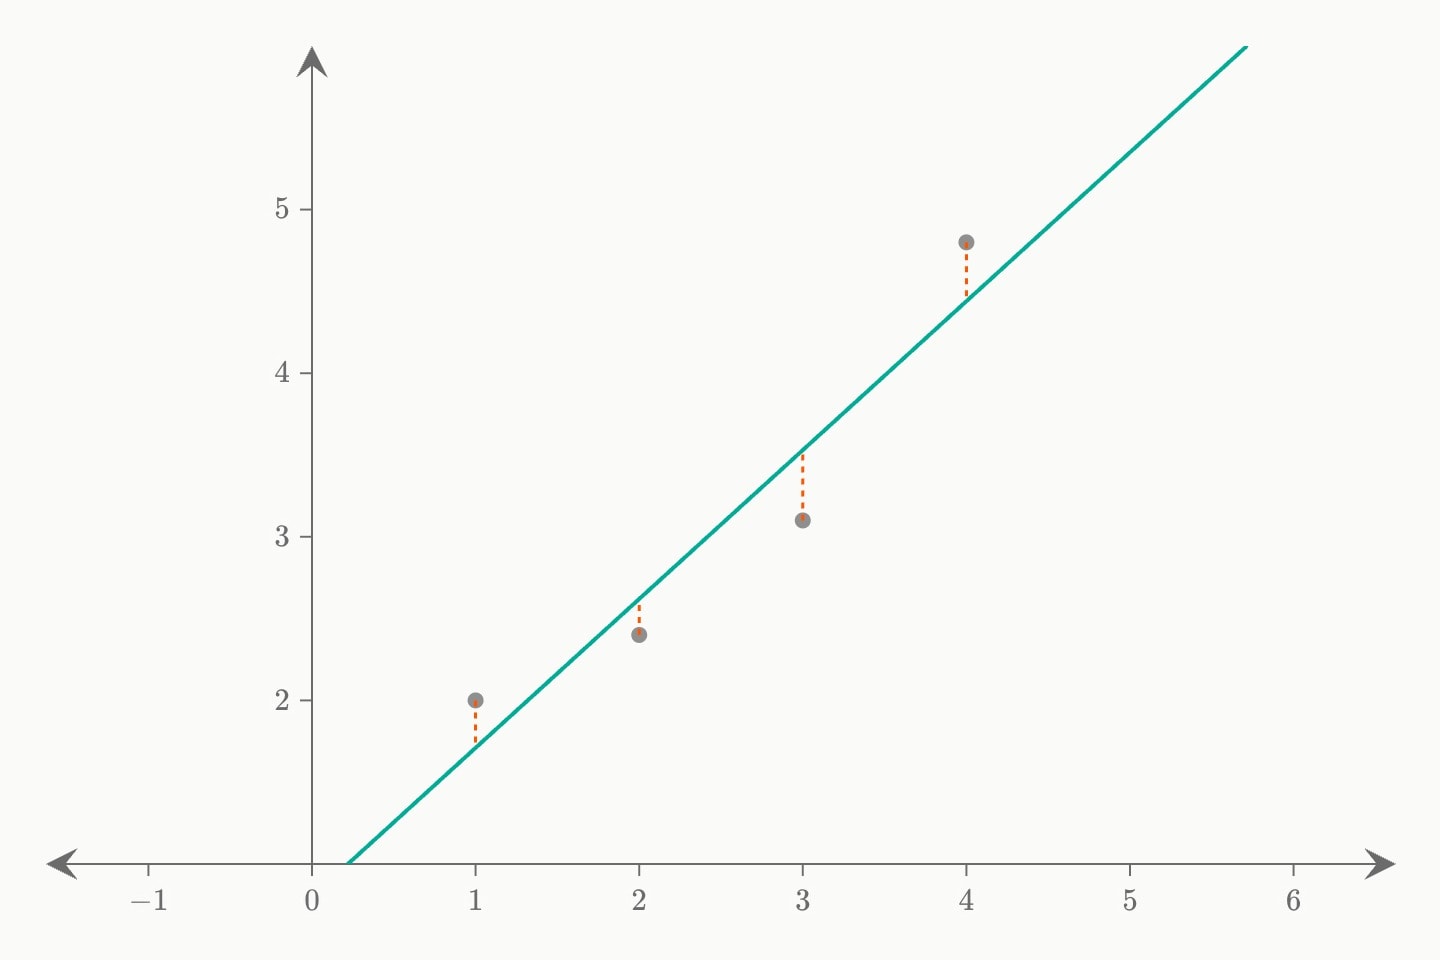
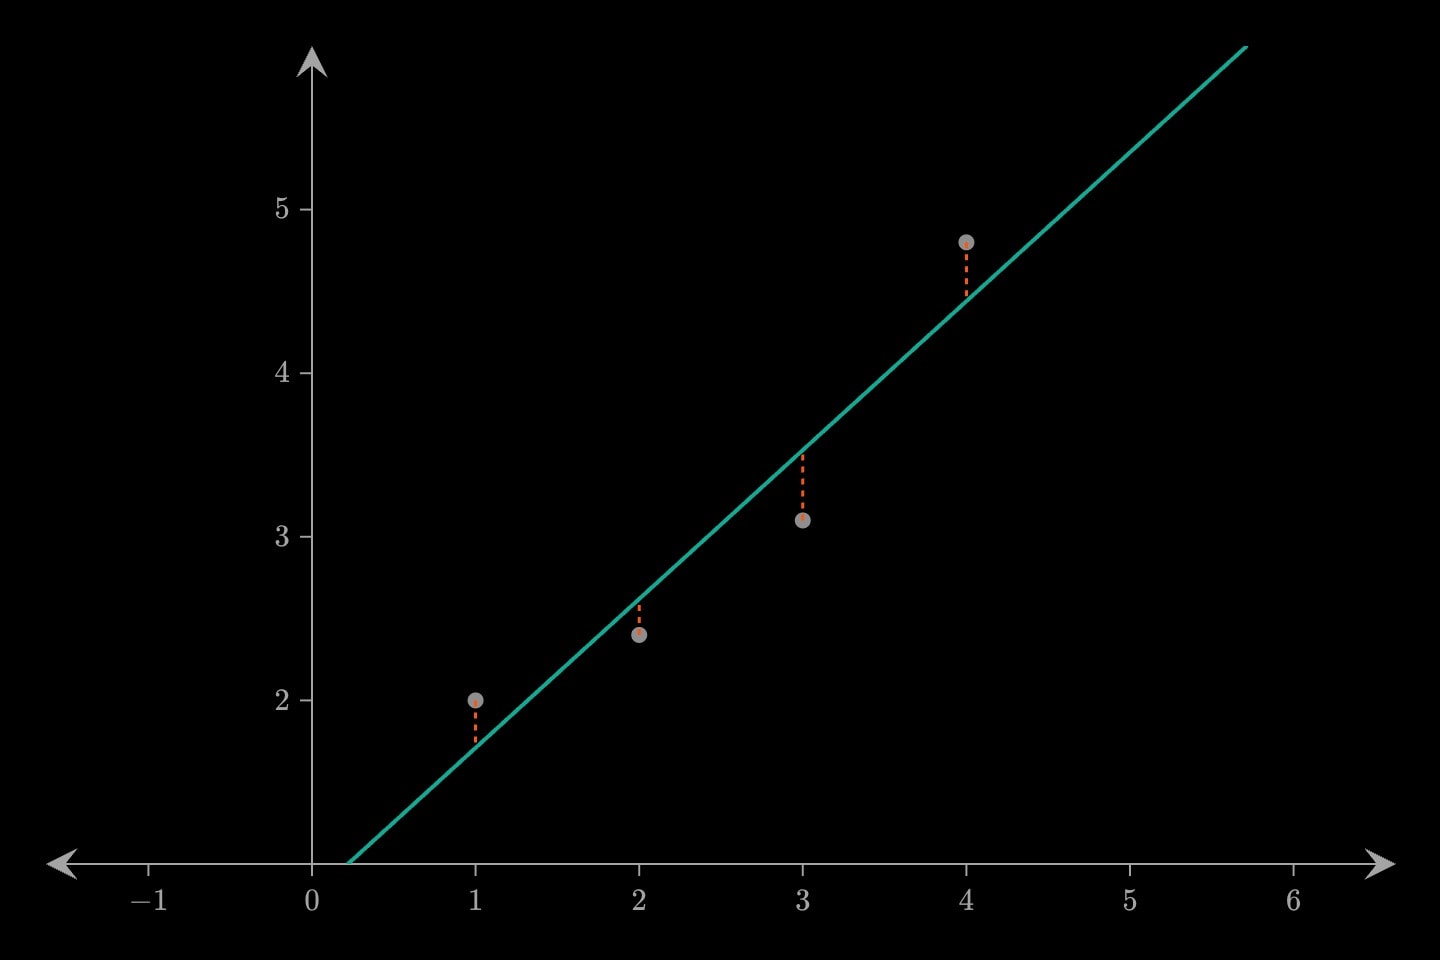
Residuals draw the vertical differences from a fit to the points it was found from: residuals(of: #trend; colour: orange), or just residuals where the graph holds a single fit.
#Attributes
ofThe fit to measure from, by its id —
residuals(of: #trend). The points drawn are that fit's own. Omitted, it takes the graph's only fit.Can be written as shorthand:
residuals:valuecolourColour.
bluelight-bluedark-blueredlight-reddark-redorangelight-orangedark-orangeyellowlight-yellowdark-yellowteallight-tealdark-tealgreenlight-greendark-greenpinklight-pinkdark-pinkpurplelight-purpledark-purplegreylight-greydark-greyneutralhex(…)rgb(…)colorDefault
orangewidthStroke width.
Default
1.5hiddenDeclared but not drawn. Animatable —
hidden: true !cue.to{false}(at: 2) reveals it — and unlike a cue, a hidden element still frames the plot, so the axes do not jump when it appears.Default
falselockKeeps the reader from editing this element on an
editable: graph. Nothing at all on a graph that is not editable.Also written:
lockedDefault
false#Allowed in
#Examples
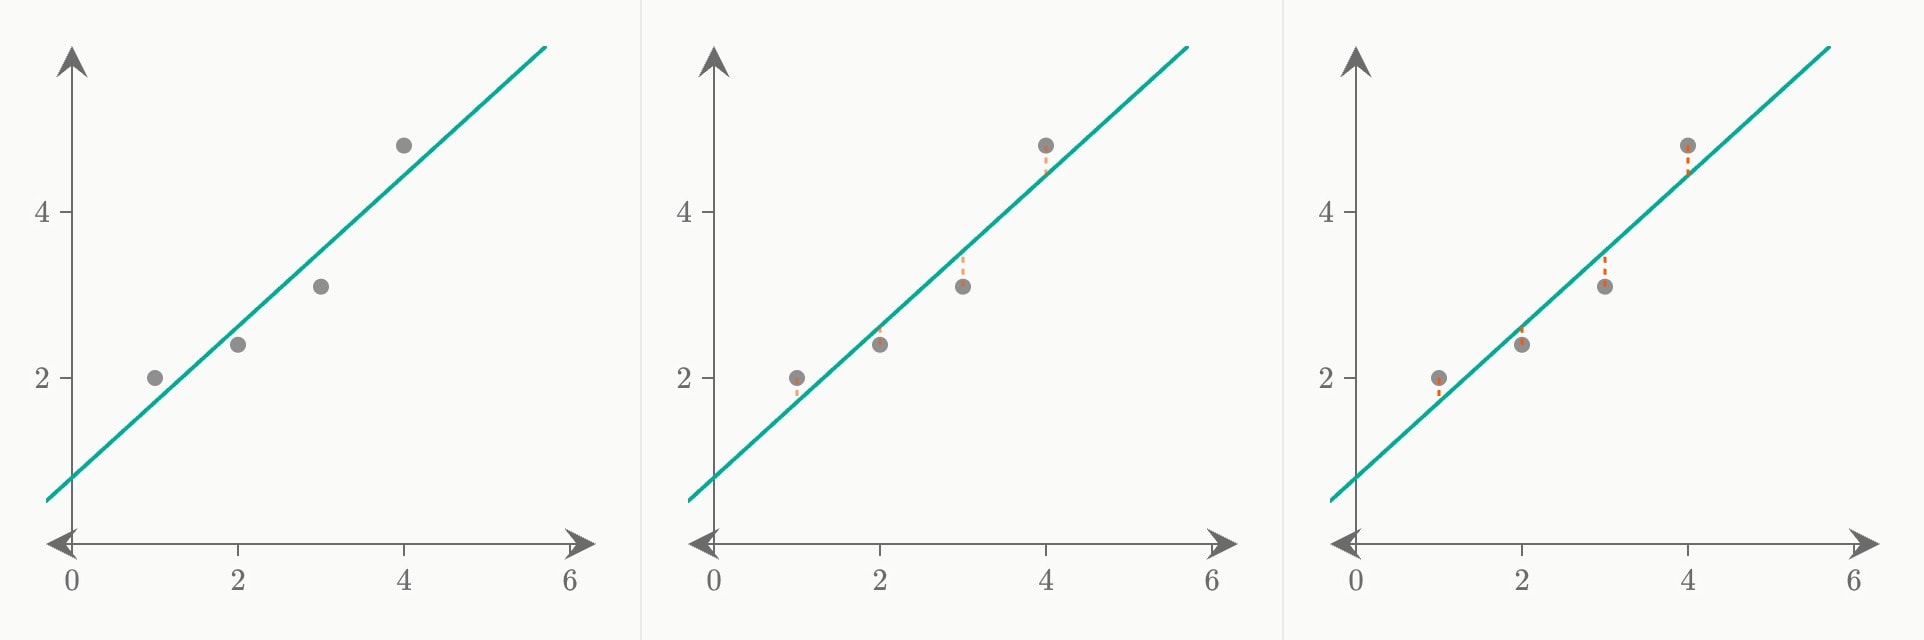
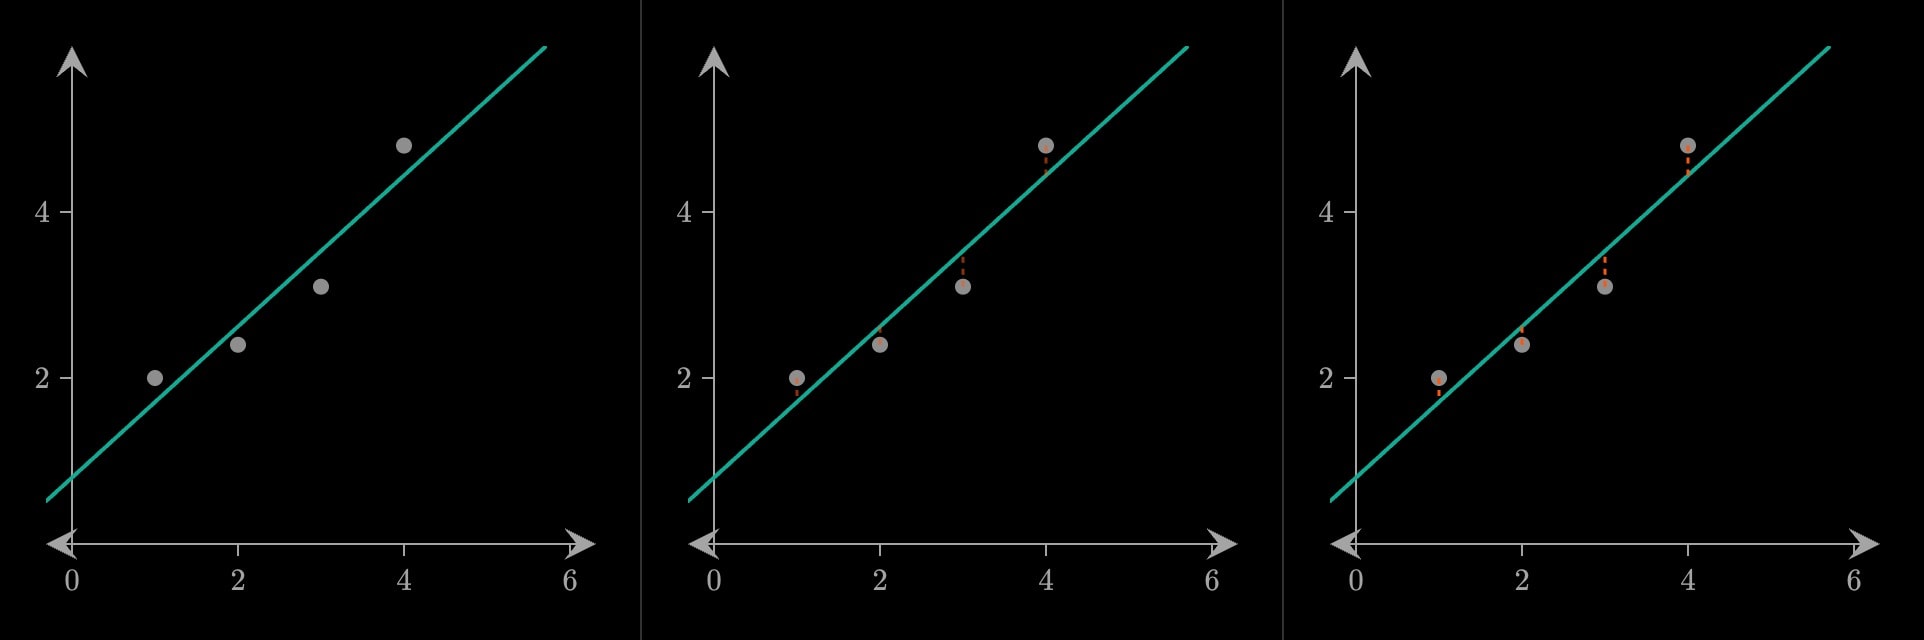
canvas.graph{
    scatter#readings(x: 1, 2, 3, 4; y: 2.0, 2.4, 3.1, 4.8; colour: grey)
    fit#trend(of: #readings; degree: 1; colour: teal)
    cue{
        residuals(of: #trend; colour: orange)
    }(
        in: 1
    )
}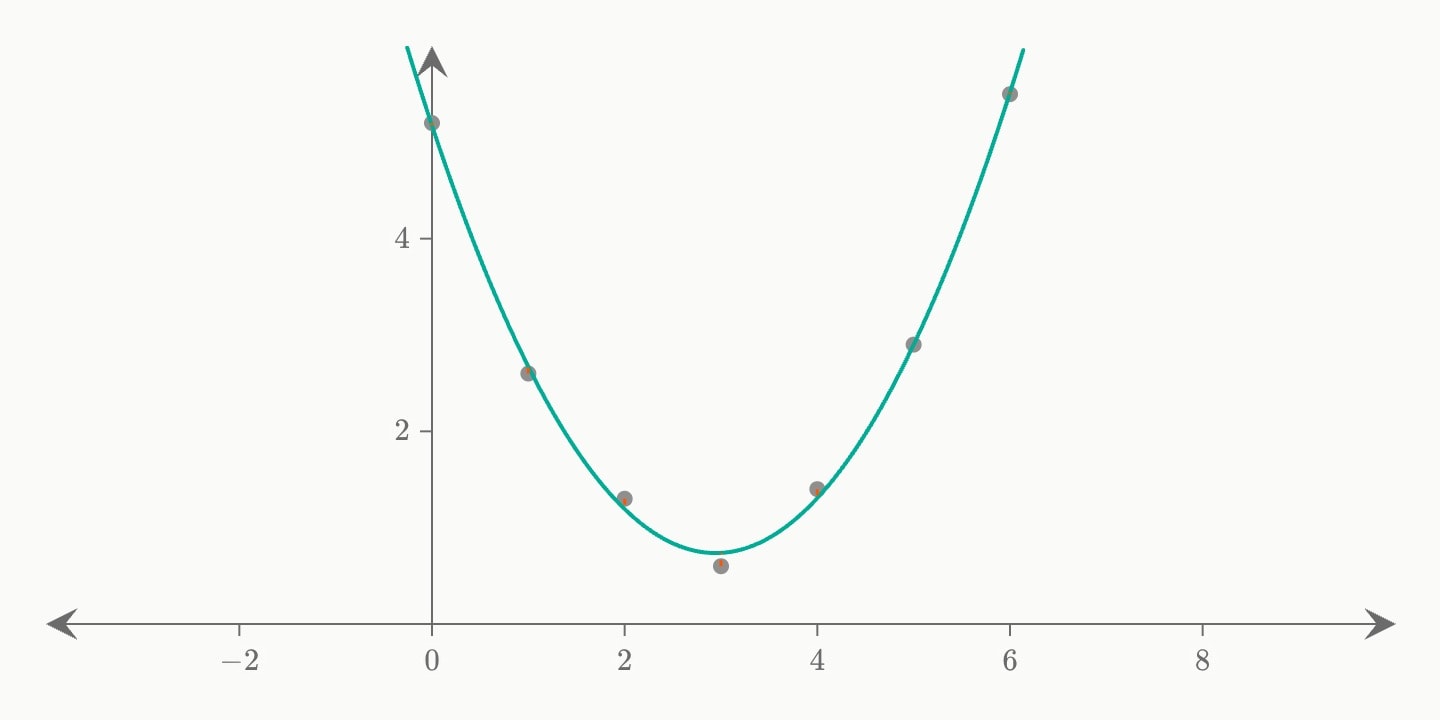
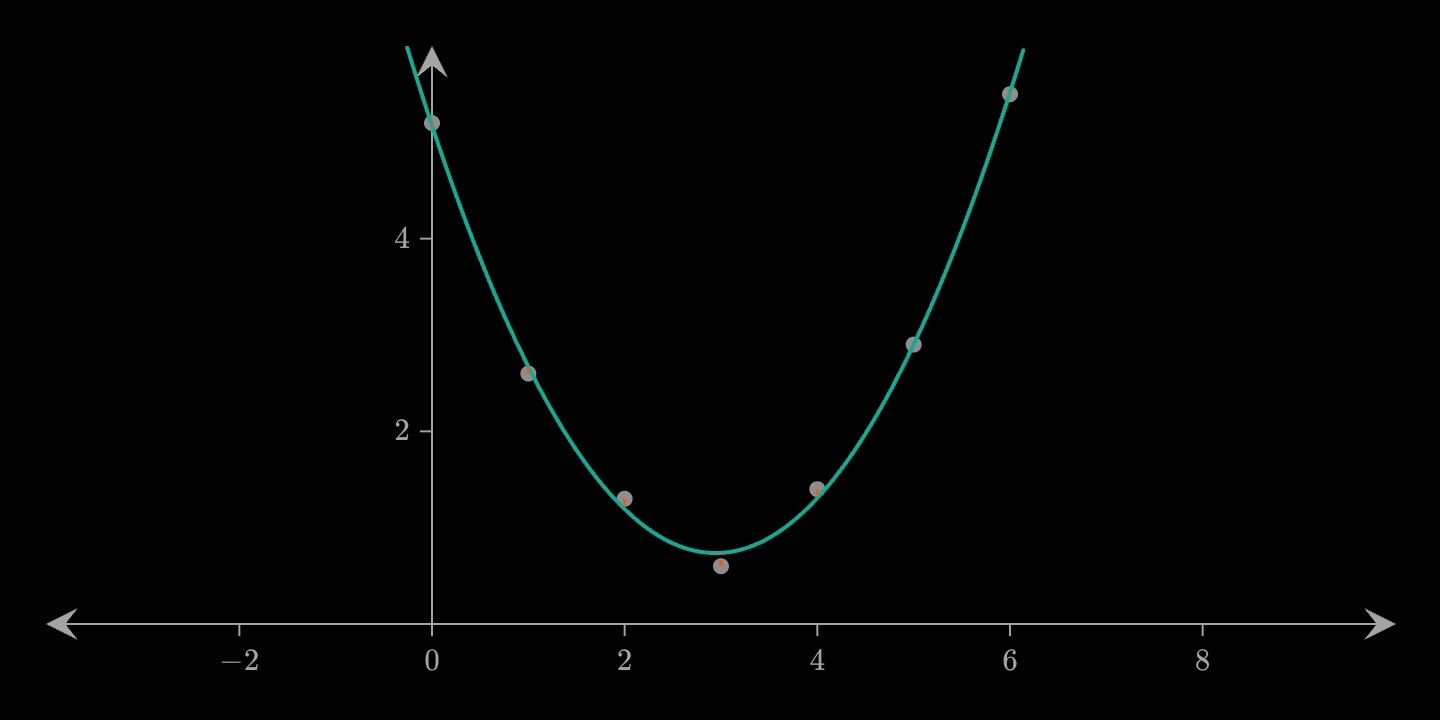
canvas.graph{
    scatter#readings(x: 0, 1, 2, 3, 4, 5, 6; y: 5.2, 2.6, 1.3, 0.6, 1.4, 2.9, 5.5; colour: grey)
    fit#trend(of: #readings; degree: 2)
    residuals(of: #trend)
}