bar
Bars standing at the names of one axis, each reaching to its value along the other.
#Names and values
bar(x: North, South, East; y: 42, 31, 55) stands a bar at each name, reaching from the baseline to its value. x and y are series, as a scatter's are: paired by position, written out or bound whole (bar(x: #sales.region; y: #sales.revenue)). Exactly one axis is ruled in names — by the names in its series under auto, or by x format: / y format: — and the other is the value axis, which always reaches the baseline. Which axis holds the names is the orientation: names on y lay the bars out sideways.
bar(x: 1, 2, 3; y: 42, 31, 55)[canvas/bar-axes]'bar' stands on a categorical axis, and neither axis is one — name the categories in 'x:' or 'y:', or rule an axis with 'x format:' / 'y format:'
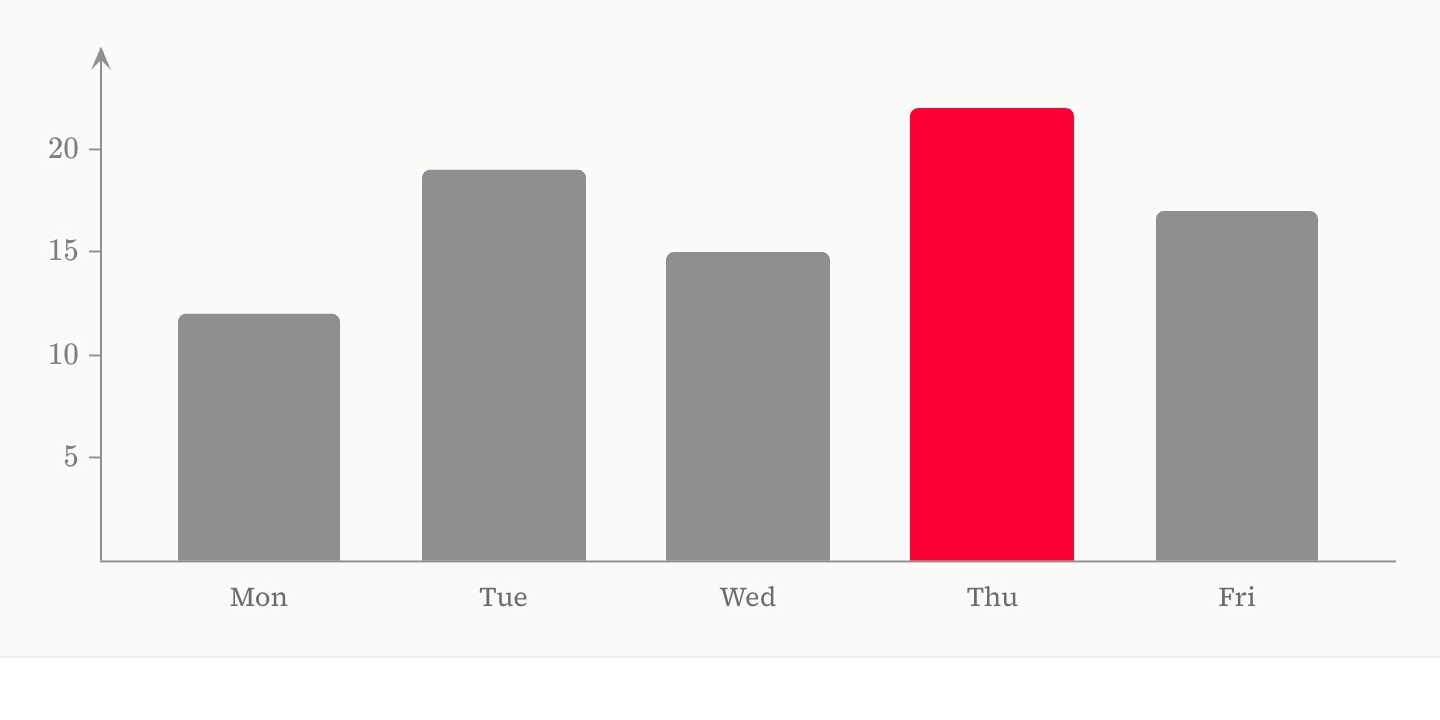
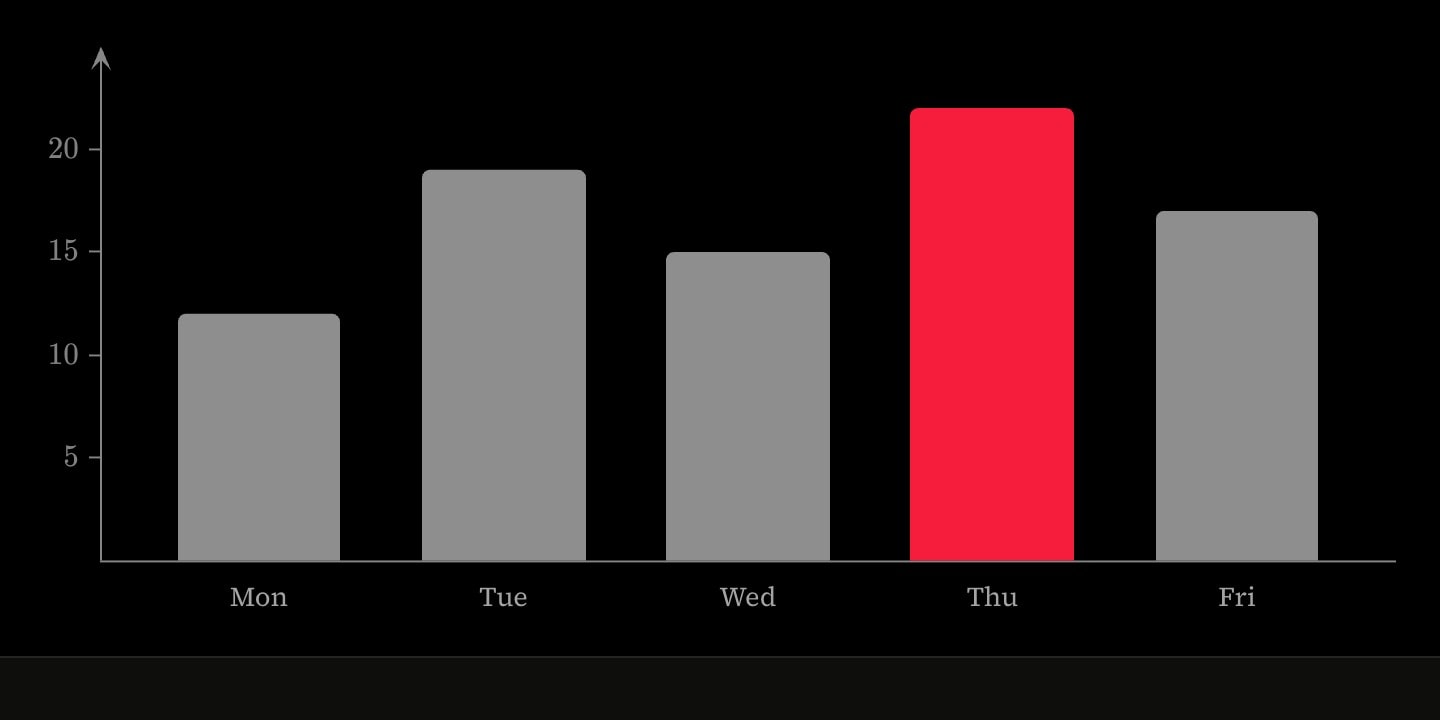
Bars on a numeric axis are a histogram, whose widths are bin edges. A list in colour is cycled bar by bar, so one bar is picked out by its place in the list — colour: grey, grey, grey, red, grey colours the fourth. A map colours bars by their data: colour: #sales.region -> (North: orange) picks out the bar standing at North, the rest keeping the default blue, and colour: #self.value -> (..<0: red; 0..: teal) the bars by their values (Styling marks from data). show-labels writes each value at its bar's end.
#Several bars at one name
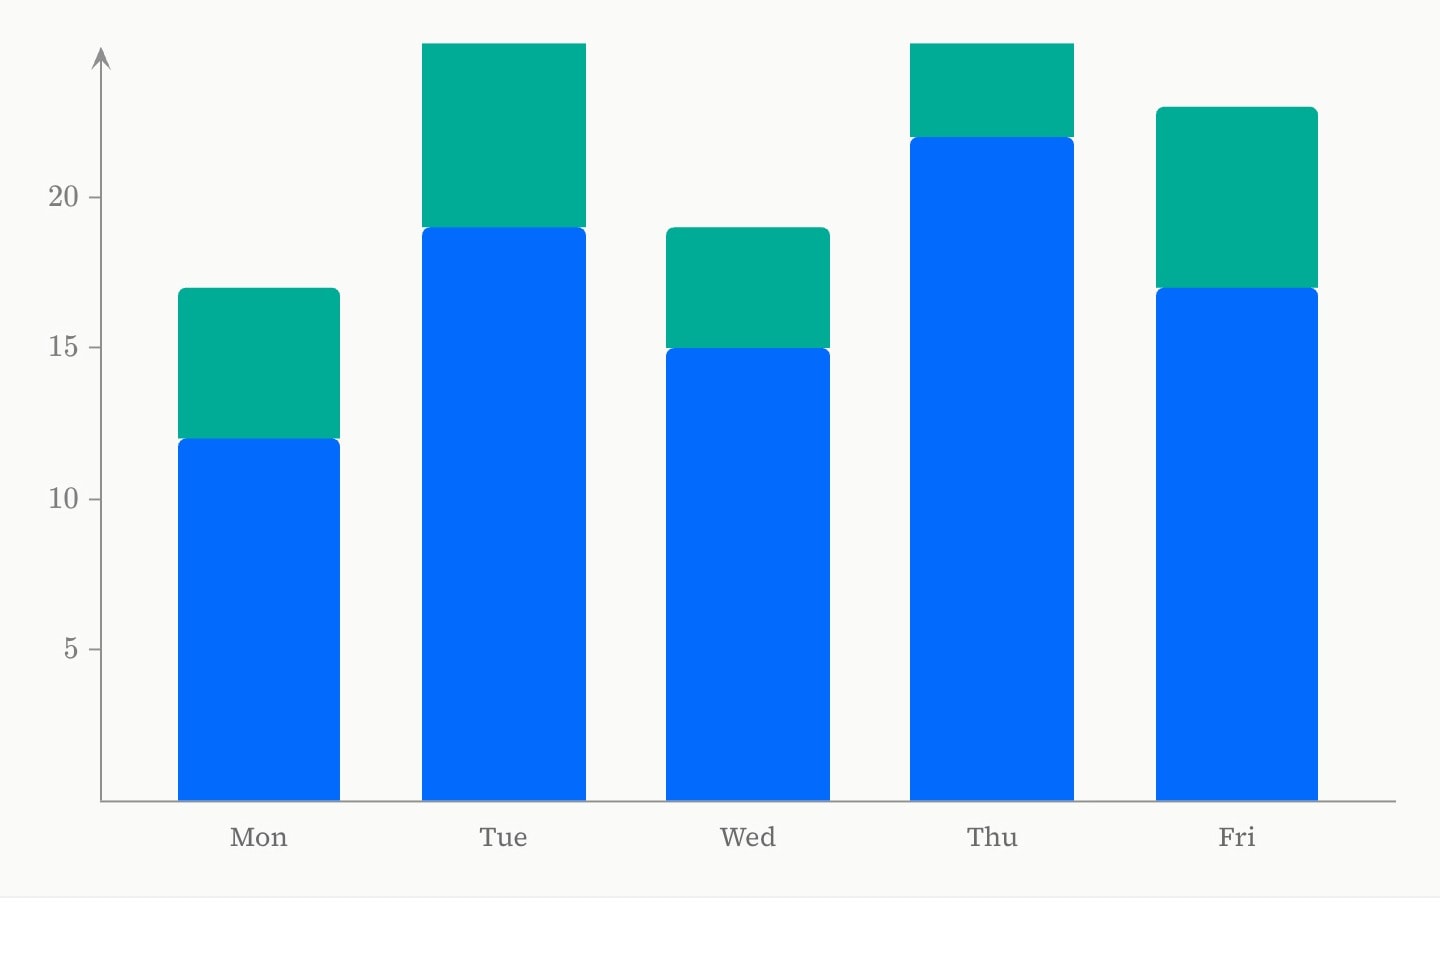
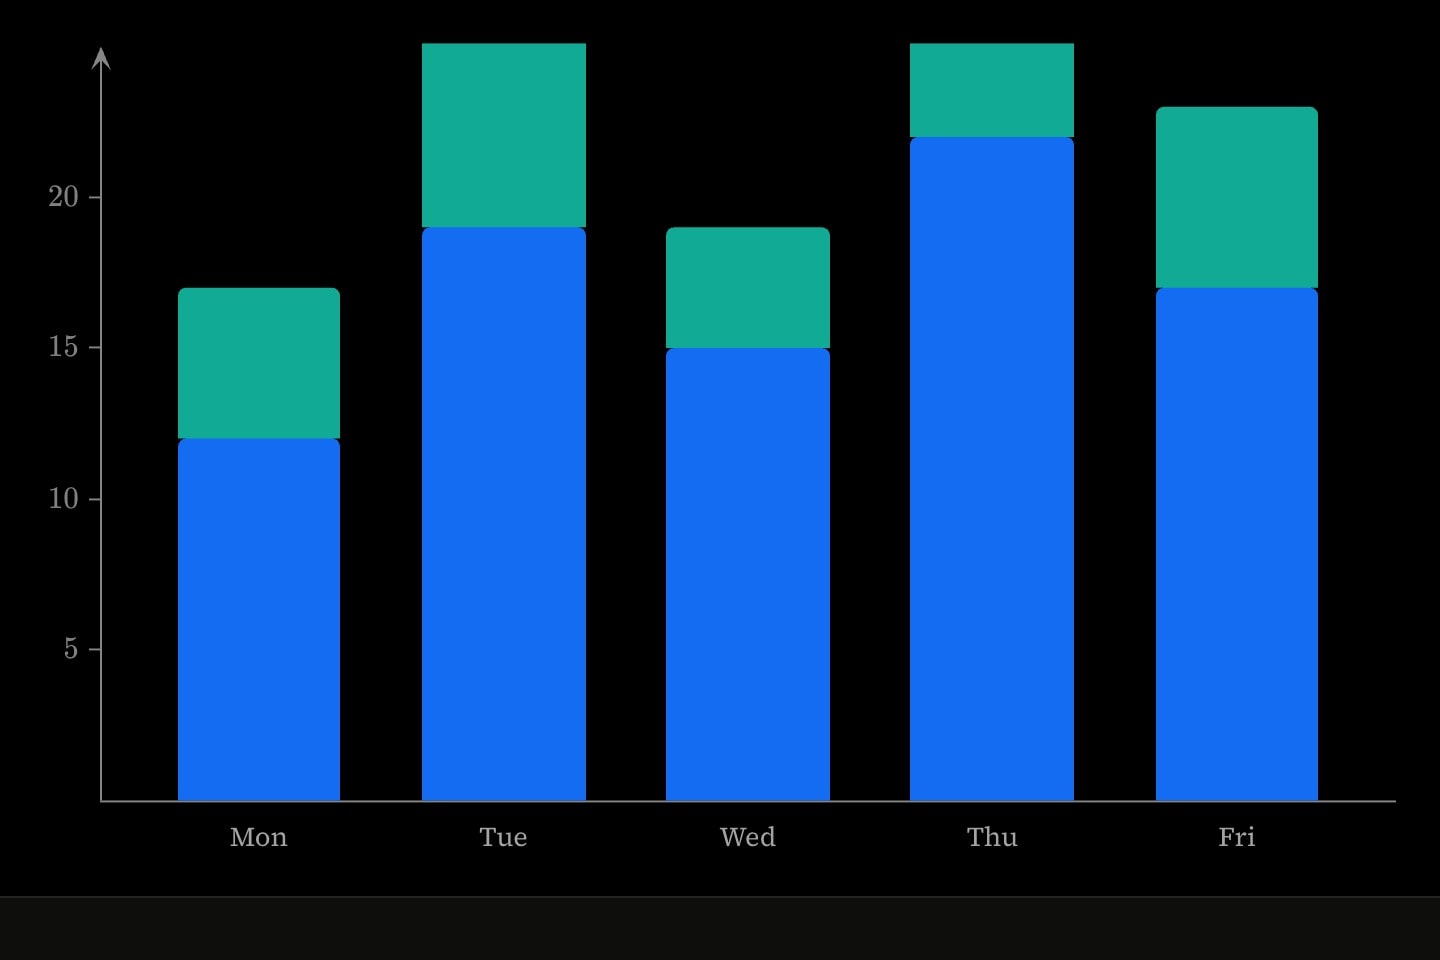
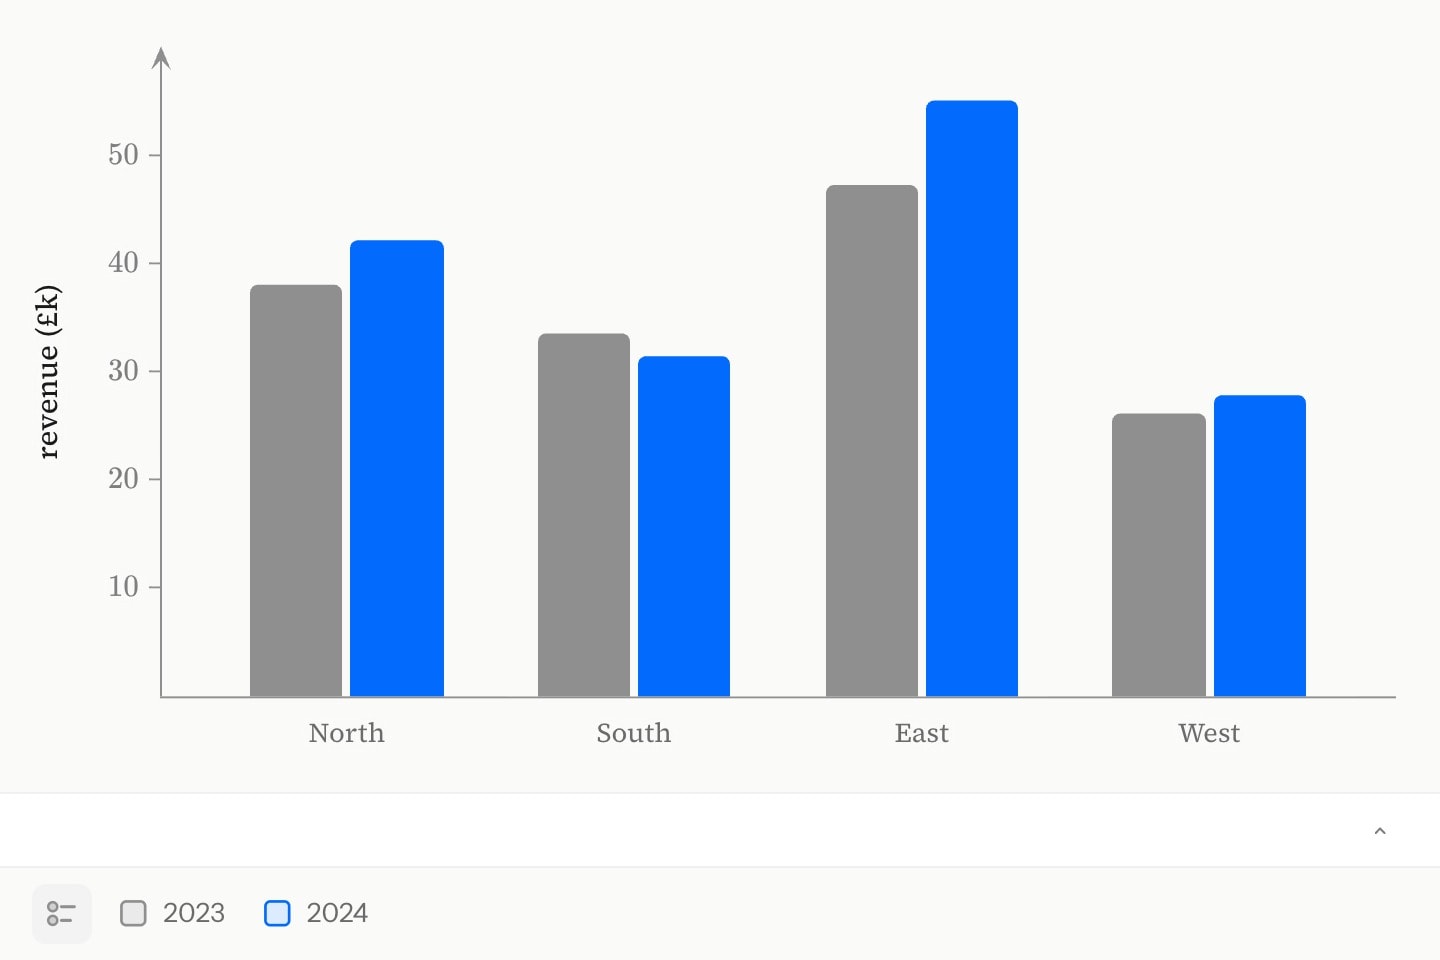
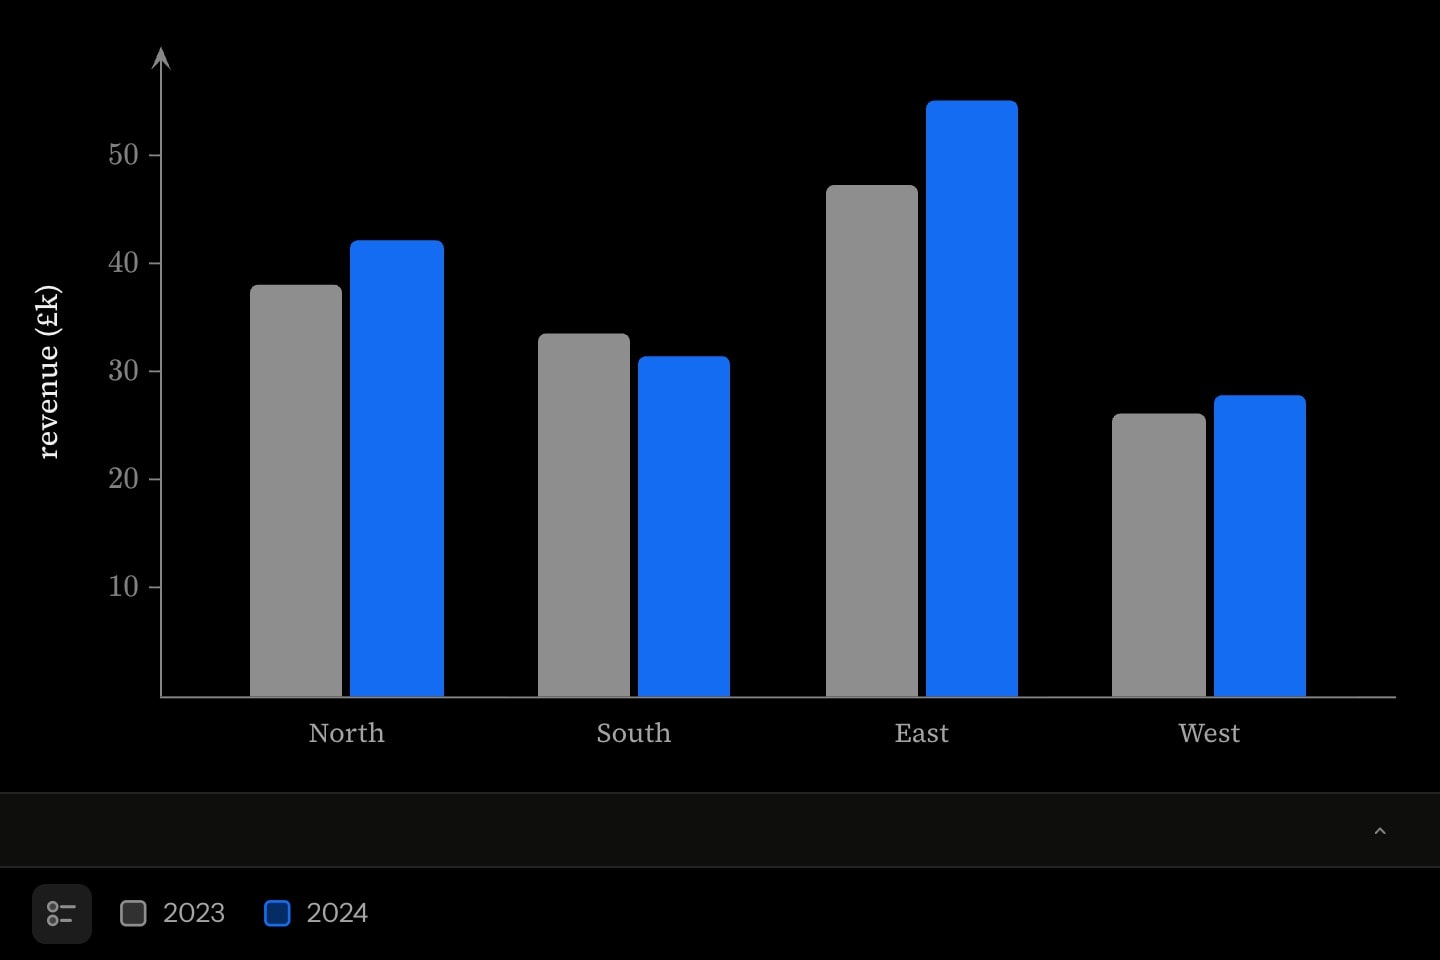
Each bar written is one series. Where several have a bar at the same name they split the band there in source order; where only one does, its bar takes the band whole. band is the share of the band the bars at a name fill. stack stands a bar's values on top of the bar written before it, name by name, so a run of stacked bars builds one column. A hidden bar takes no share of the band.
graph{
    @data#sales{
        region | y2023 | y2024
        North  | 38.0  | 42.1
        South  | 33.5  | 31.4
        East   | 47.2  | 55.0
        West   | 26.1  | 27.8
    }

    bar(x: #sales.region; y: #sales.y2023; colour: grey; label: 2023)
    bar(x: #sales.region; y: #sales.y2024; colour: blue; label: 2024)
}(
    y axis label: revenue (£k)
)#Bars over periods
Long-format data has one row per name per period. slice names the period column, and the bars show the period that the scene's parameter over that column holds — a slider or selector whose column: is the same column. A numeric period column glides between the periods either side; a column of names selects one. covers the shape of the rows.
graph{
    slider:t(column: #sales.year; name: Year)
    bar(x: #sales.region; y: #sales.revenue; slice: #sales.year)
}#Error bars
error draws a capped bar through the middle of each bar's end, along the value axis, in the bar's edge colour. It is written as a scatter's is: a half-width per bar, such as a standard deviation, or the interval's two ends, error: #trials.lo .. #trials.hi.
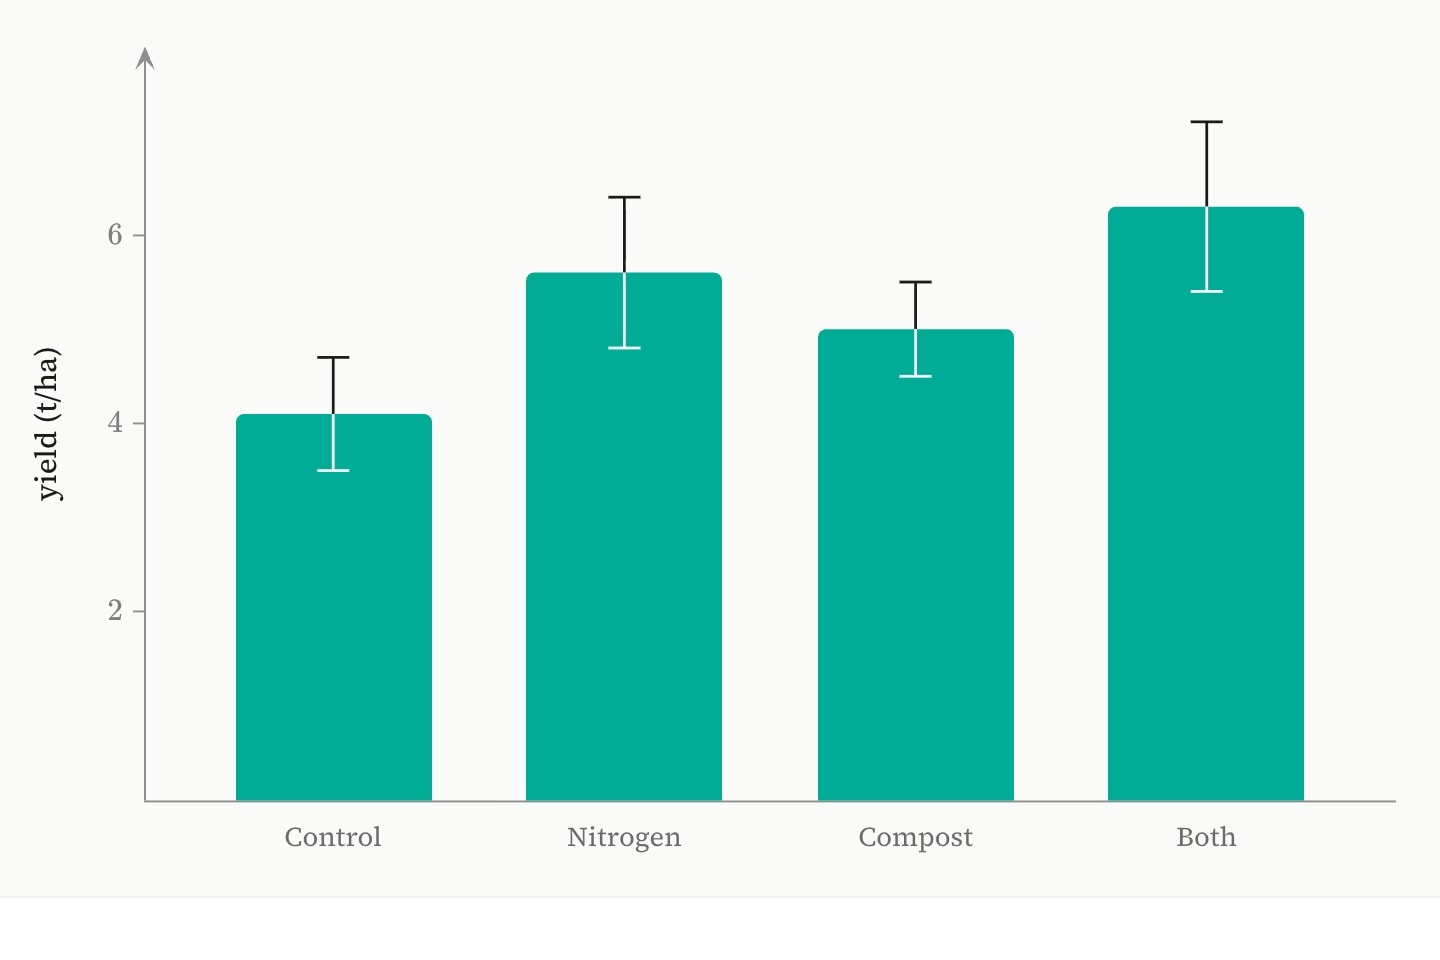
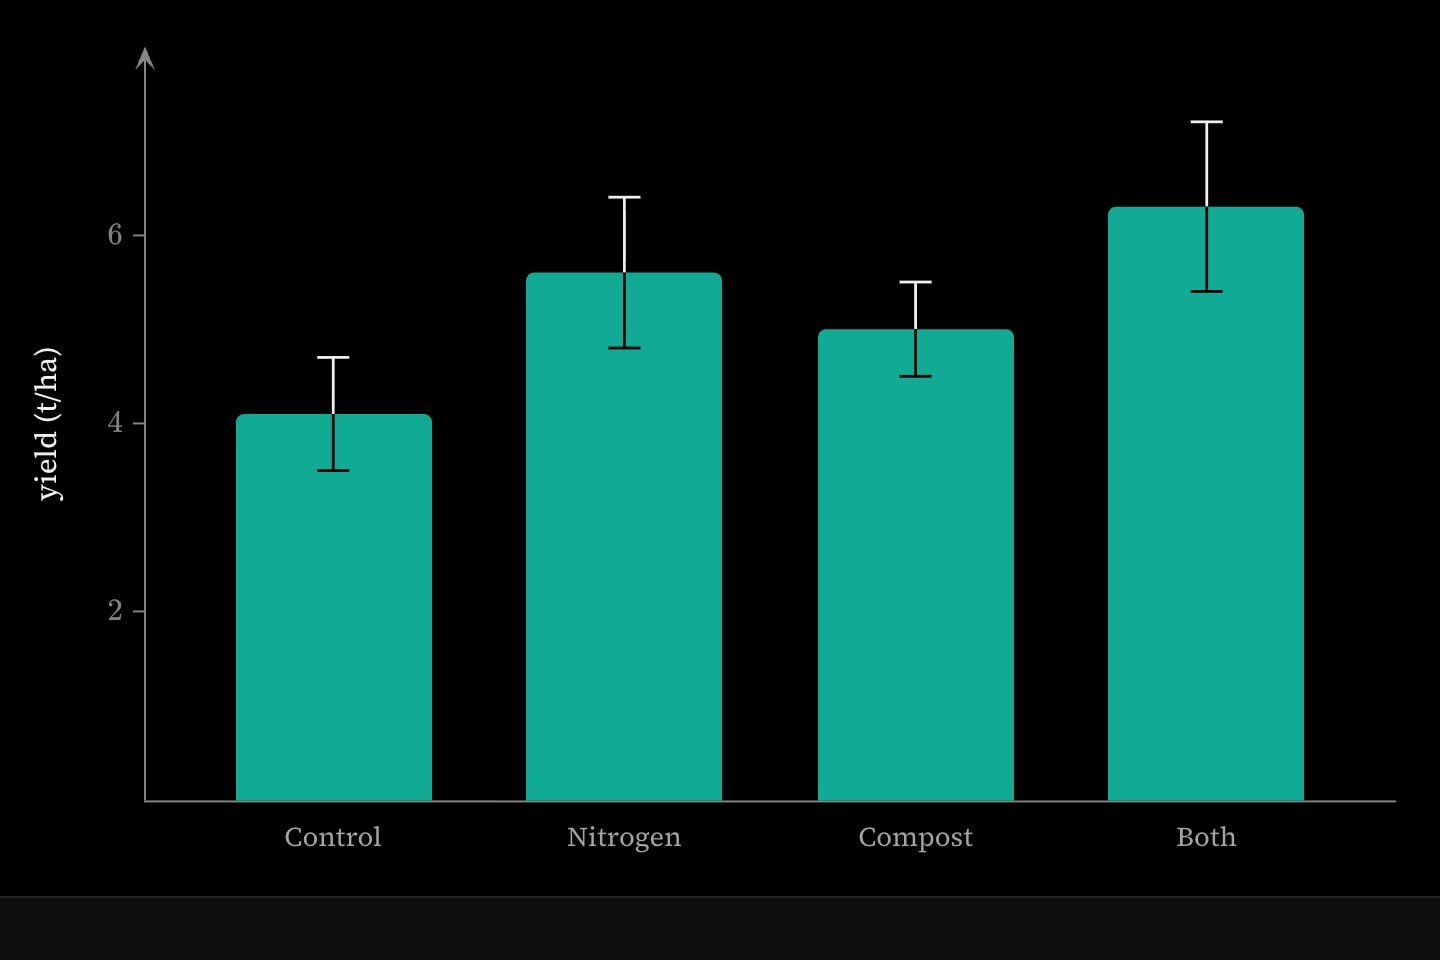
graph{
    @data#yield{
        feed     | mean | sd
        Control  | 4.1  | 0.6
        Nitrogen | 5.6  | 0.8
        Compost  | 5.0  | 0.5
        Both     | 6.3  | 0.9
    }

    bar(x: #yield.feed; y: #yield.mean; error: #yield.sd; colour: teal)
}(
    y axis label: yield (t/ha)
)
A stack bar ends at a running total rather than at its own reading, so it takes no error; neither does a rose or a column in space (canvas/plane-attribute).
#Roses and columns
On the polar plane a bar chart is a rose: the bars stand at names on theta and reach out along r, so theta must be ruled in names (canvas/bar-axes). In space, bar(x: …; y: …; z: …) stands a column at each (x, y) on the floor, as tall as its z; either floor axis may be names or numbers, and stack and show-labels are refused.
#Attributes
reim by position.imre by position.slicecolour#self.value, the bar's value. colour: #self.value -> (..<0: red; 0..: blue) bands the bars by value; a map keyed by names applied to a column gives categories, colour: #sales.region -> (North: teal; otherwise: grey).colour-stylecolorblueopacity#self.value.opacity-style1band0.7stackstackedfalseshow-labelslabelsfalselabel$maths$ and inline formatting render. Fades and draws with the element.hiddenhidden: true !cue.to{false}(at: 2) reveals it — and unlike a cue, a hidden element still frames the plot, so the axes do not jump when it appears.falselockeditable: graph. Nothing at all on a graph that is not editable.lockedfalsetext-size20layerz: before the argand plane took that letter for its coordinate.groupgroup: Treated, Projected. It is drawn in the colour of the first group that has one, over its own colour:, and the footer's key names every group. A stroke the graph's key: gives a group does not change it.xyplanex#sales.region). Paired with y by position; a pair either axis cannot read is dropped whole.bar:valueyx by position.errorerror: #trials.lo .. #trials.hi, or 0.7..1.1, 0.8..1.3 — as a scatter's error: takes. Refused on a stack: bar, whose end is a running total rather than its own reading.polarplanertheta by position. A rose reaches each bar out to its reading.theta60deg for degrees), paired with r by position; names on a categorical theta. A rose stands its bars at names — theta: North, East, South, West, or theta format:.xyzplanex#sales.region). Paired with y by position; a pair either axis cannot read is dropped whole.bar:valueyx by position.zx and y: written out, or a column bound whole (#sales.amount).#Derived attributes
Computed while the element renders — read one with #id.name in attribute position or {{#id.name}} in prose, never set.
value#self.value: colour: #self.value -> (..<0: red; 0..: teal).totalstack: bar's own segments, not the height of the column it tops — following a slice or slider, in the value axis's units, each mark of a group counting only its own; in space, of its columns' heights; a dash with none.maxstack: bar's own segments, not the height of the column it tops — following a slice or slider, in the value axis's units; in space, of its columns' heights; a dash with none.minstack: bar's own segments, not the height of the column it tops — following a slice or slider, in the value axis's units; in space, of its columns' heights; a dash with none.countstack: bar's segments, never the column it tops, and each mark of a group side by side separately; 0 with none.#Allowed in
#Examples
graph{
    bar(
        x: Mon, Tue, Wed, Thu, Fri
        y: 12, 19, 15, 22, 17
        colour: grey, grey, grey, red, grey
    )
}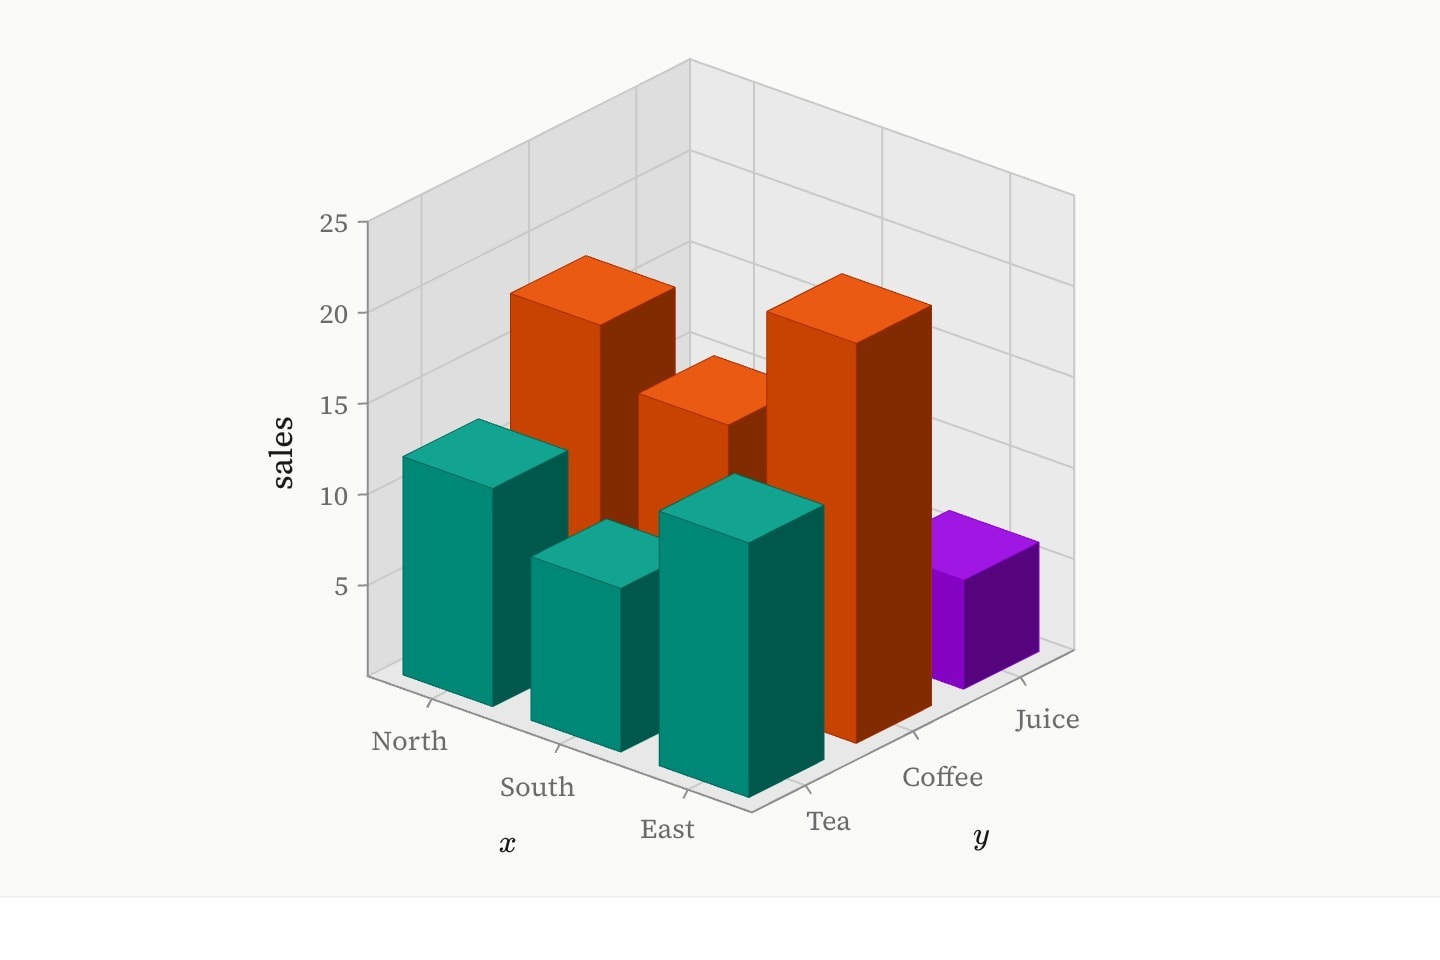
graph:xyz{
    bar(
        x: North, South, East, North, South, East, North, South, East
        y: Tea, Tea, Tea, Coffee, Coffee, Coffee, Juice, Juice, Juice
        z: 12, 9, 14, 18, 15, 22, 7, 10, 6
        colour: teal, teal, teal, orange, orange, orange, purple, purple, purple
    )
}(
    z axis label: sales
    view: (-50, 25)
)#Writing guidance
- Framing a readable graph — When to write a domain, the defaults left alone, naming a series, the ticks the prose reads, and one meaning per hue.