Expressions
Writing maths a graph can plot, the parameters a reader can move, and the {{…}} group that computes a value anywhere in a document.
#Writing an expression
Wherever a graph wants a function, it takes a math expression in x: curve(expression: x^2 - 2x + 1), sin(a * x), 100 - 4.9x^2. Powers use ^, the usual functions are available by name, and multiplication may be implicit — 4.9x^2, 2(x + 1) and (m - px) / q with multi-letter parameter runs all parse.
#Parameters
A slider declares a parameter and gives the reader a track for it. Every expression in the SCENE mentioning that letter re-evaluates as it moves — a parameter is the scene's, so a control in one graph drives an expression in another. A parameter read by an expression is named with one letter, because that is what the expression parser reads; Interaction covers the controls themselves.
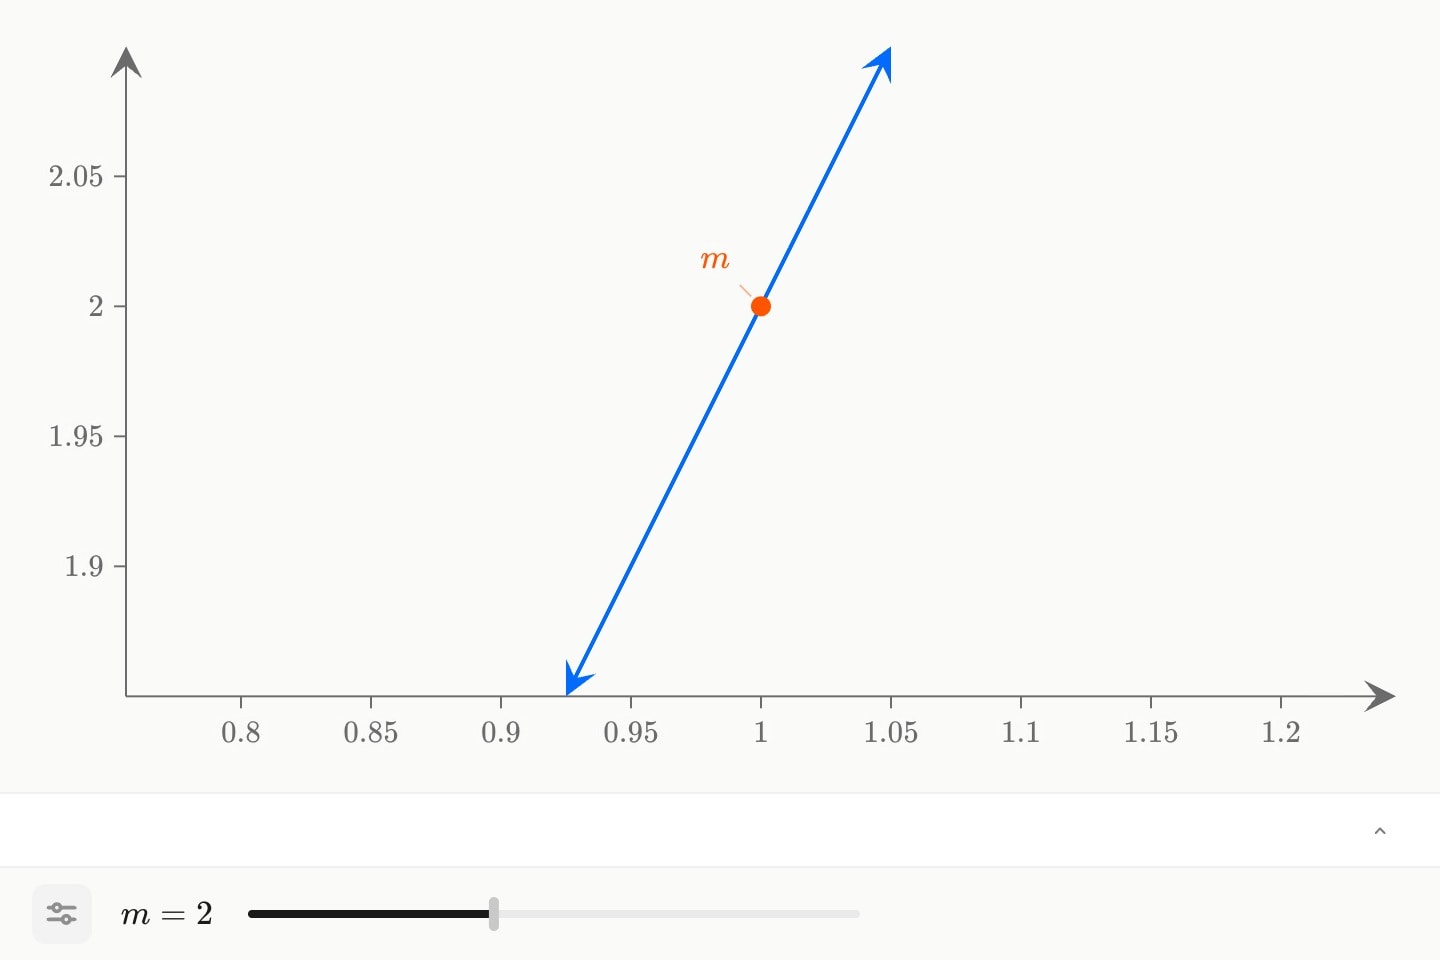
canvas.graph{
    slider:m(range: [0, 5]; default: 2)
    curve#f(expression: m * x)
    point(x: 1; y: m; label: $m$)
}#Every parametised- attribute type
Any attribute whose type carries parametised- takes an expression where a plain value would otherwise stand — a point's coordinates may be (a, 2a), a curve's domain [0, b], an integral's bound from: m - s. The attribute types page lists each of them and what it accepts; every reference page names the type of each of its attributes.
#The {{…}} group
That is the graph's own expression language, written bare in an attribute. There is a second one, which belongs to the document rather than to the canvas: a {{…}} group holds an expression the compiler evaluates, and it may stand in any value position at all — an attribute, a header field, a line of prose.
The fitted exponent is {{round(#trend.r2 * 100, 1)}}%.

curve(degree: {{k}})
point(size: {{2 * base-size}})
An expression may contain numbers, the constants pi and e, references (#id.member), arithmetic (+ - * / ^, unary -, parentheses), and the functions below. There is no separate text-substitution form: {{k}} is the expression k, which is why a constant that holds text still works — a constant's text is untyped and takes the type of the position it lands in. So (units: metres) then {{units}} in prose is fine, and {{units + 1}} is an error.
#The function set
The set is closed. Arity is checked when the document compiles, and so is any domain failure the compiler can see, so an expression that reaches the renderer can only fail on a value the reader is moving.
round(x, places?)— half away from zero.ceil,floor,abs.clamp(x, lo, hi), and the variadicmin(…)andmax(…).sin cos tan asin acos atan sinh cosh tanh,exp,sqrt.logandln— both natural.log10is base ten.erf,gamma,choose(n, k),factorial(n).
log is the natural logarithm, not the base-ten one. If you want base ten, write log10. This is the one place where a reasonable guess gives a wrong number silently.Two spelling rules matter as much as the vocabulary. Adjacency is a product — 2k, 2(x + 1), (a)(b), 2 sin(x) — and a name is a maximal alphanumeric run beginning with a letter. So 2k is two tokens, because a literal begins with a digit, but kx and k2 are single names. To multiply two named values write k x or k*x. Names are lowercased, so T and t are one name — use period and t rather than relying on the case.
A name may carry a member tail: row.area is one name, not a product with a dot in it. There is exactly one thing a dotted name reads — the cell of a dataset row, inside a over that dataset — so {{row.area * 2}} is arithmetic on that row's cell. It is never a free name: an unresolved dotted name says either that the row has no such column, listing the ones it has, or that the name is not a row at all (which is what {{i.area}} under a plain :3 gets).
#Free names
Every name in an expression must resolve. A name that is not a function, a builtin or a constant in scope is an error at the line that wrote it — {{2k}} with no k declared reports undefined constant `k`, so a mistyped constant name is caught rather than silently becoming something that never arrives.
equation-typed position — an attribute a library declares as a formula over named variables — a name that is neither one of those variables nor a constant in scope is a free name: typed number, lowercased, scoped to its template expansion like an id, and left for the renderer to supply. It is the one place an unresolved name is legal, because a formula is a rule rather than a value and its inputs arrive later.A {{…}} group inside an equation position is left for the equation to read as a subtree rather than resolved on its own, so the two kinds of name can sit side by side in one formula: in {{2x}} + {{a}} under variables: x, the x binds as the equation's variable and the a as a constant — or, undeclared, as a free name.
No construct in this library takes an equation, so no internote written against it carries a free name. Where a graph wants a formula it takes one of the parametised- attribute types described above, whose letters are the graph's own and are resolved by the environment rather than by the compiler.
#Reading another construct
{{#id.member}} reads the attribute's typed value, and it resolves document-wide — forwards as readily as backwards, so prose may cite a fit that appears in a later scene. A number takes part in the arithmetic around it; an enum is its canonical value; a dataset column is its cells as a list, comma-joined when it lands in text.
The line rises {{#trend.slope}} per year, or {{100 * #trend.slope}} per century.Reading a derived attribute this way makes the expression bound: it cannot finish at compile time, because the value does not exist until the canvas computes it. That is not an error — the tree travels to the renderer and is evaluated there, every frame, exactly as any other bound expression is. Cycles among such expressions are errors.
#Where a bound value is refused
A bound value is refused wherever the compiler itself has to read the result. It cannot wait for the renderer in these places, so it says so:
- an
pair, and'sn— the count, the range, or the dataset it walks; - an id —
figure#f-{{i}}outside a loop has noito read, and is an error; - a @data cell;
- a
literalbody, and a code environment's body; - a dynamic switch's discriminant, a declaration's
default, and a directive head.
These positions also keep the in-order rule: a forward {{#id.member}} resolves everywhere else, but not here. A may hold a bound value — the refusal lands where it is used, not where it is written.
(x: - item one) then {{x}} on a line of its own is a paragraph whose text begins with a hyphen, not a list item. Only a @define section declared as constructs splices structure. Inline markup in a constant still scans, so (name: **bold**) is bold where it lands.