slider
A parameter the reader drags along a track, surfaced as a row in the scene's footer. It declares the parameter as well as offering it: slider:a(range: [0, 5]) is the letter a between 0 and 5, and every expression in the SCENE that mentions a re-evaluates as it moves — a control written inside one graph drives a curve in another beside it. name: is what it is called in front of the reader — rich text, so Frequency $b$ sets its own maths — and without one the row is labelled with the parameter itself. The current value is derived: prose cites it with {{#a.value}}, which reaches the control by its node id, so a control the prose cites is written with one (slider#spread:s(…)). The plain case, and the one to reach for: a quantity that moves continuously, so every value between the ends is one the reader can stop at. over: binds it to a dataset column instead, so its range, its stops and its format come from the cells rather than being written out — a slider over a column of years is a year scrubber with nothing else said, and every mark carrying a slice: over that column reads itself against it. To have the scene drive it rather than the reader, write cue.slider; to offer a handful of choices rather than a track, selector.
slider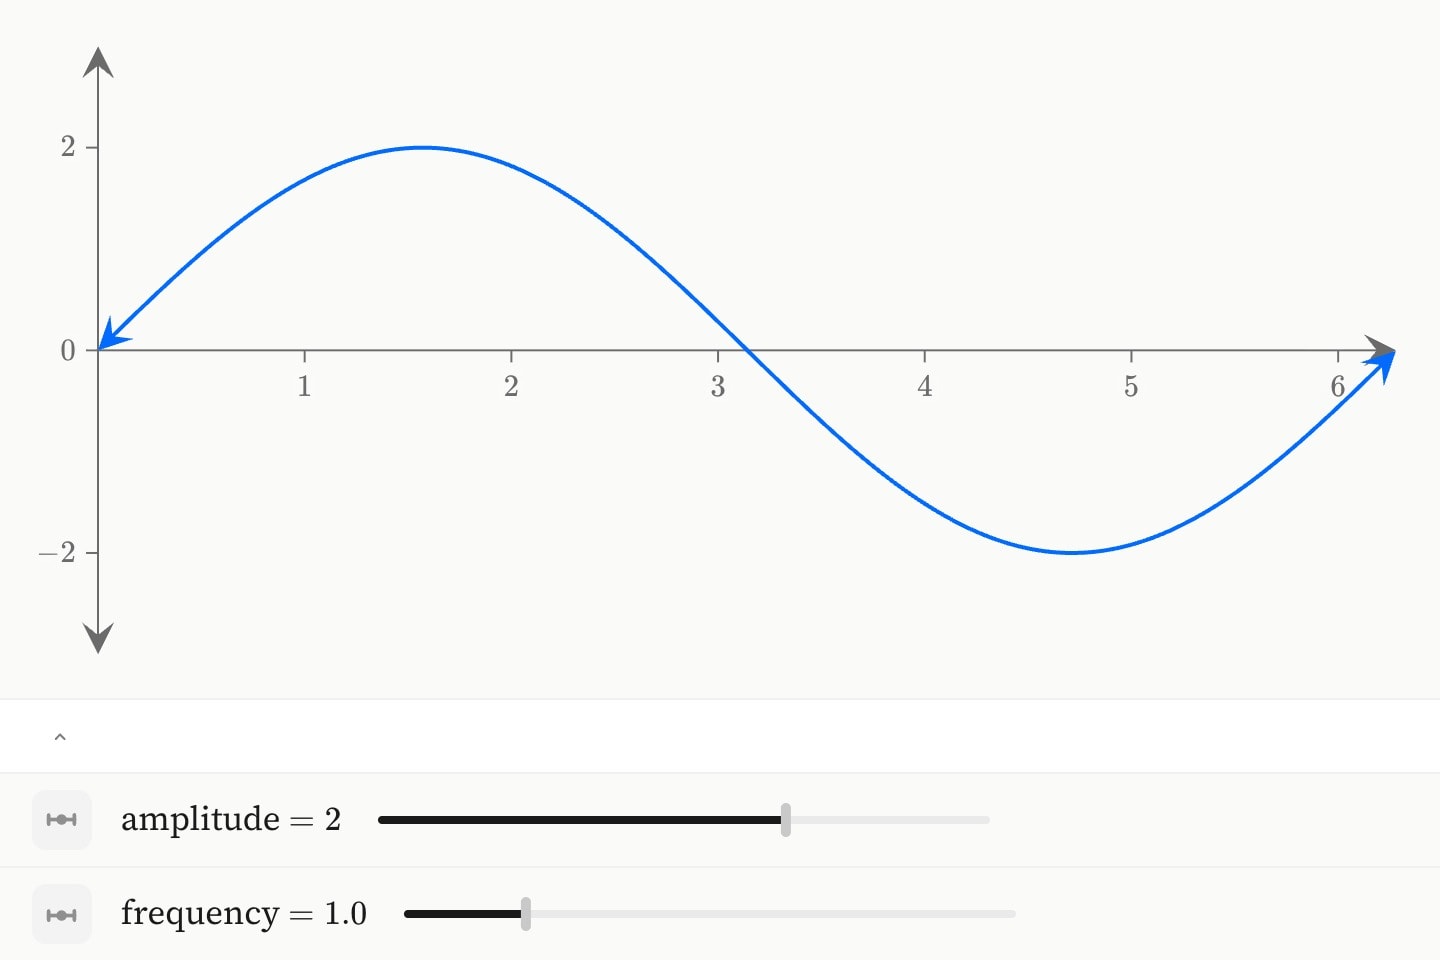
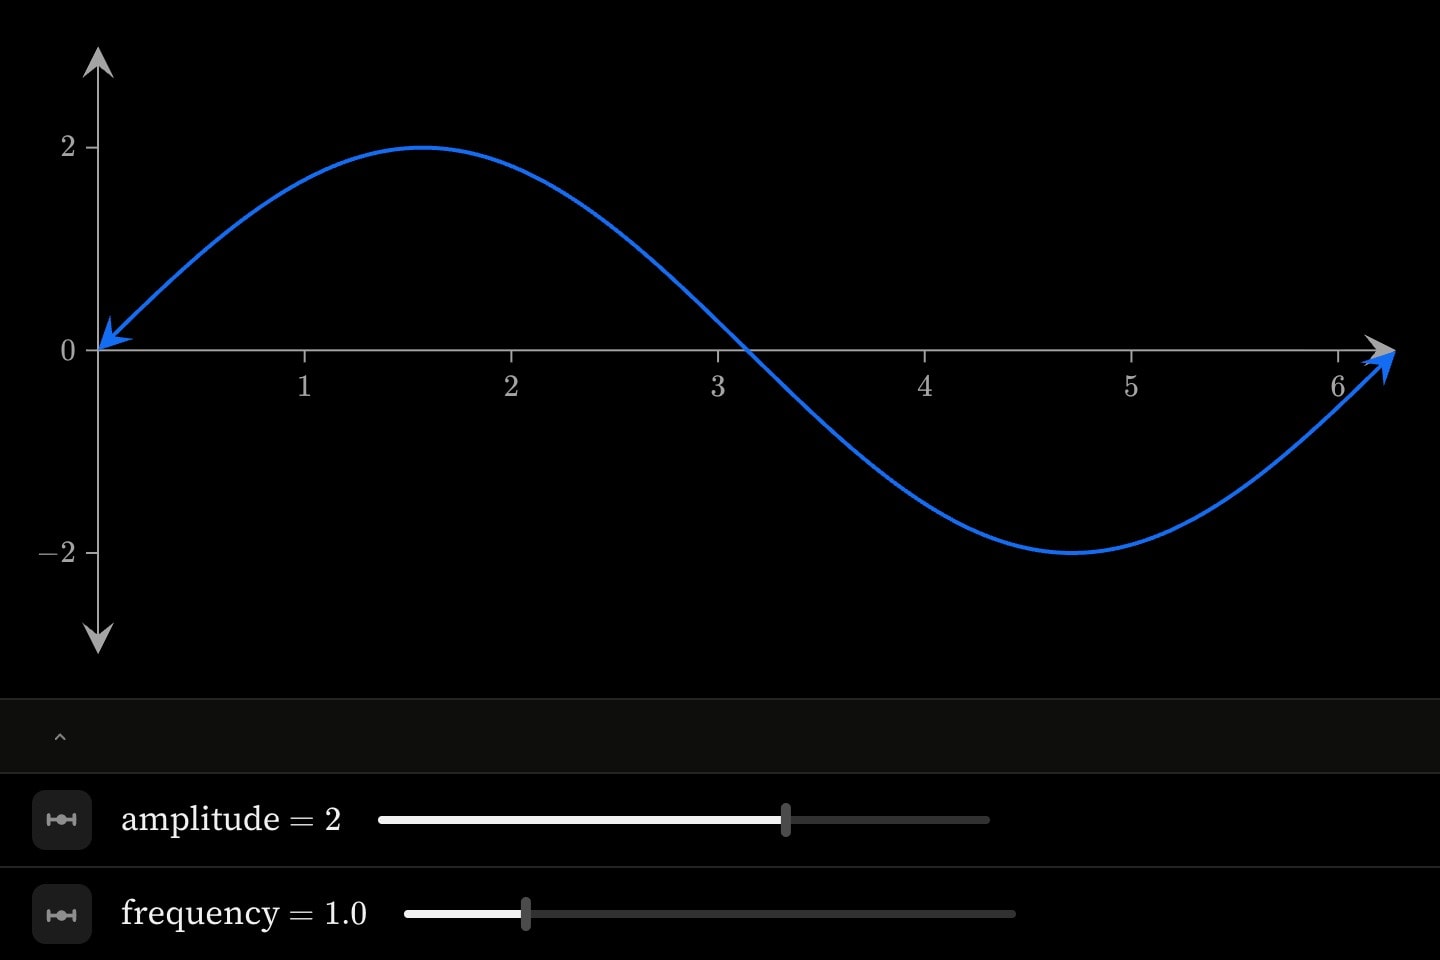
#Attributes
parameterslider:a, and the whole scene's a from then on. One letter is the ordinary case, and the only one an expression can read: curve: a*x^2 reaches it by that letter. A word (selector:country) is for a parameter that never appears in a formula, and cannot be read in maths — to the expression parser country is a product of seven letters.parameter-namevarCan be written as shorthand: slider:valuenamelabeloverover: #pop.year. Its cells are the stops, their span is the range, and what they are decides the format — so range: is not consulted where this is given. A column of NAMES gives a parameter whose values are those names. This is the shape long-format data arrives in, and the shape a mark's slice: reads: the mark names the column, not the parameter, and the two meet at the column.columnformatnumbers, dates, months, weekdays, hours, weeks or names. Every one but the last places a value on its own number line — position 1…12 for a month, a fractional year for a date — so the range stays a pair of numbers and only the reading changes. names has no number line: the values are the data's own words. auto takes the kind from the column over: names, and is numeric where no column was named.autonumbersdatesmonthsweekdayshoursweeksnamesvaluesautorangeover: or options: gives the stops: those decide.[-10, 10]stepover:, the closest the data's own values come to each other, which is the spacing that can reach every row.defaultover:, the first value in the column. Where the stops are names this is an INDEX among them, since a name has no number line to sit on; writing the wanted one first in options: is the usual way to say which opens.starthiddenfalselockeditable: graph.lockedfalsediscretediscrete, it snaps to the nearest — the data's own values, or the step ladder — and the marks jump from one slice to the next, for a quantity that is not a continuous function of the axis.steppedfalse#Derived attributes
Computed while the element renders — read one with #id.name in attribute position or {{#id.name}} in prose, never set.
value#Allowed in
#Examples
slider:a(name: steepness; range: [0, 4]; step: 0.25; default: 2)
curve(f: a * x^2; domain: [-3, 3])slider#years:t(over: #pop.year; name: Year)slider:m(format: months; range: [1, 12]; step: 1; name: Month)