curve
An expression in x plotted as a curve. expression is the implicit attribute; domain and range clip where it draws. Publishes derived max and min over the plotted domain.
curvexyargandpolarplane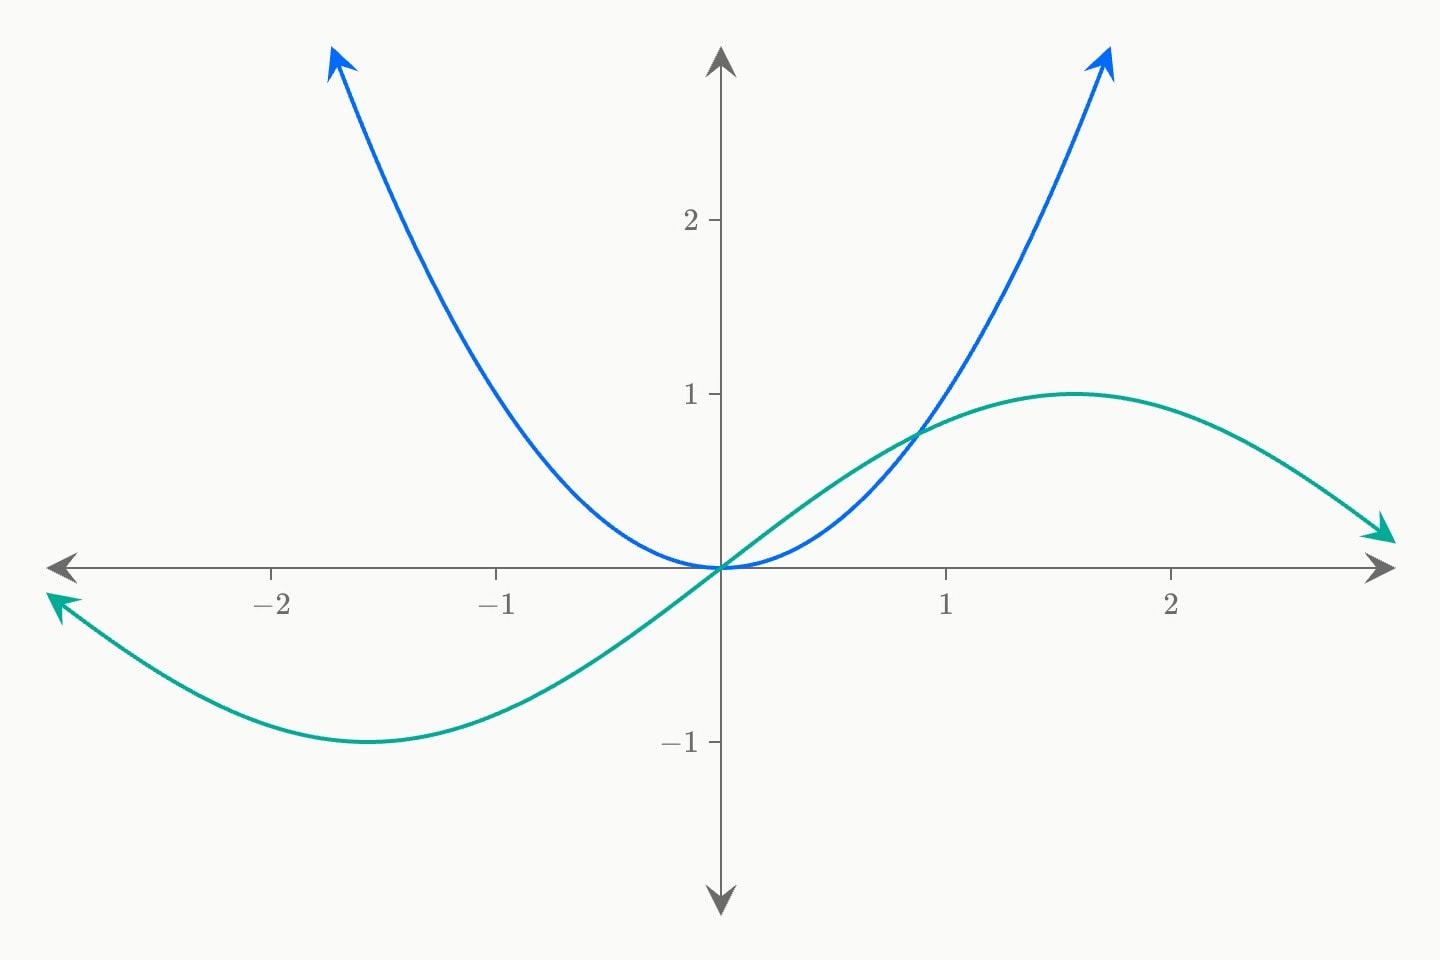
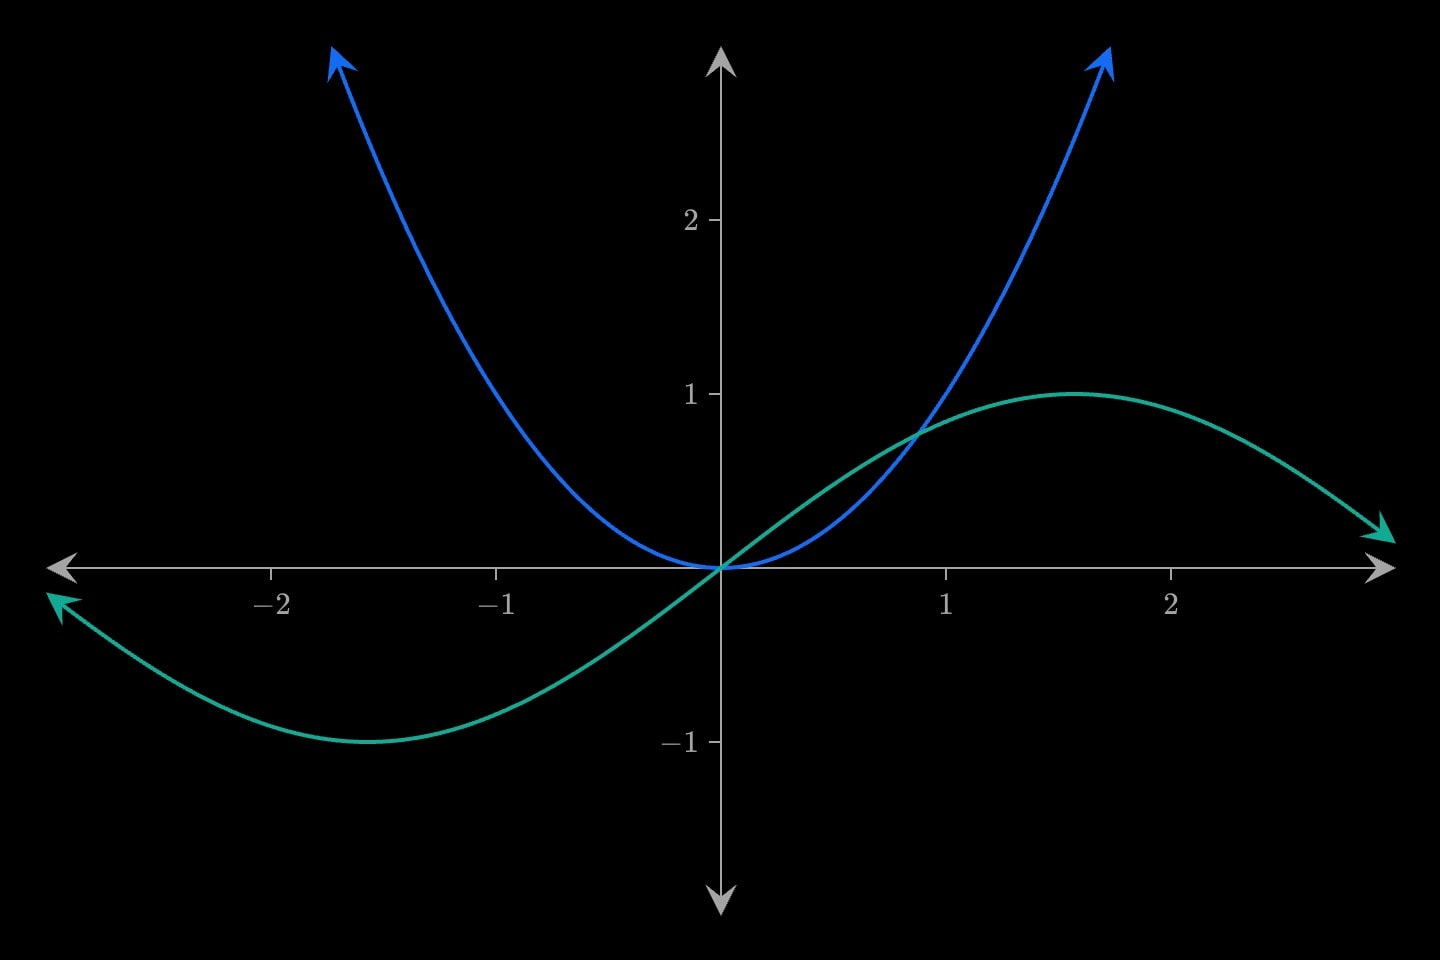
A curve plots an expression in x: curve(expression: x^2; colour: blue) — in theta on the polar plane, where it is r(θ). Expressions may reference parameters — a * sin(b * x) bends live as the reader drags a and b — and domain / range clip where it draws. A curve exposes derived max and min over its plotted domain.
A function defined in pieces is written with min(a, b), max(a, b) and clamp(x, lo, hi) rather than as several curves with clipped domains, and it stays one curve under a parameter: a response that saturates is min(2x, 10), and Huber's ρ — quadratic in the middle, linear in the tails — is the clamped distance clamp(abs(x), 0, c)^2/2 + c * (abs(x) - clamp(abs(x), 0, c)). (Not min(x^2/2, c * abs(x) - c^2/2): the two differ by (abs(x) - c)^2/2, which is never negative, so that min is the linear branch everywhere.)
Or a curve is a position in t: curve(x: cos(t); y: sin(t); t: [0, 2pi]) on the ordinary plane, z(t) on the argand one, r and theta in t on the polar one — with the interval t runs over, and no expression. A parametric curve takes fill, since its path can enclose something: a closed loop fills itself, and an arc closes across its own chord — close names a point to come back through first, so an arc closed through the centre of its circle is the sector. A y(x) curve is refused both: the region under a function is an integral, and saying so keeps one idea in one place.
#Attributes
t[0, 2pi], ends parametised. Required with the parametric coordinates; not with expression.colourbluelight-bluedark-blueredlight-reddark-redorangelight-orangedark-orangeyellowlight-yellowdark-yellowteallight-tealdark-tealgreenlight-greendark-greenpinklight-pinkdark-pinkpurplelight-purpledark-purplegreylight-greydark-greyneutralhex(…)rgb(…)colorbluewidth2dashedfalsefillclose turns that into the sector. A y(x) curve takes integral instead, which shades the area under a function and reports what it is worth.filledfalseclosepolygon has straight sides and integral closes to the axis. Nothing without fill.close-atdomainx-domainrangey-rangeendpointsarrowheads, arrow, arrowhead, arrowstruelabel$maths$ and inline formatting render. Fades and draws with the element.hiddenhidden: true !cue.to{false}(at: 2) reveals it — and unlike a cue, a hidden element still frames the plot, so the axes do not jump when it appears.falselockeditable: graph. Nothing at all on a graph that is not editable.lockedfalsetext-size20layerz: before the argand plane took that letter for its coordinate.xyplaneexpressionexp, f, func, functionCan be written as shorthand: curve:valuext, with y: and t: — curve(x: cos(t); y: sin(t); t: [0, 2pi]). On the ordinary plane; not with expression.yt, with x: and t:.argandplanezt — curve(z: sqrt(13) * e^(i * t); t: [0, 2pi]) — with t:.polarplaneexpressionexp, f, func, functionCan be written as shorthand: curve:valuert, with theta: and t:.thetat, with r: and t:.#Derived attributes
Computed while the element renders — read one with #id.name in attribute position or {{#id.name}} in prose, never set.
maxmin#Allowed in
#Examples
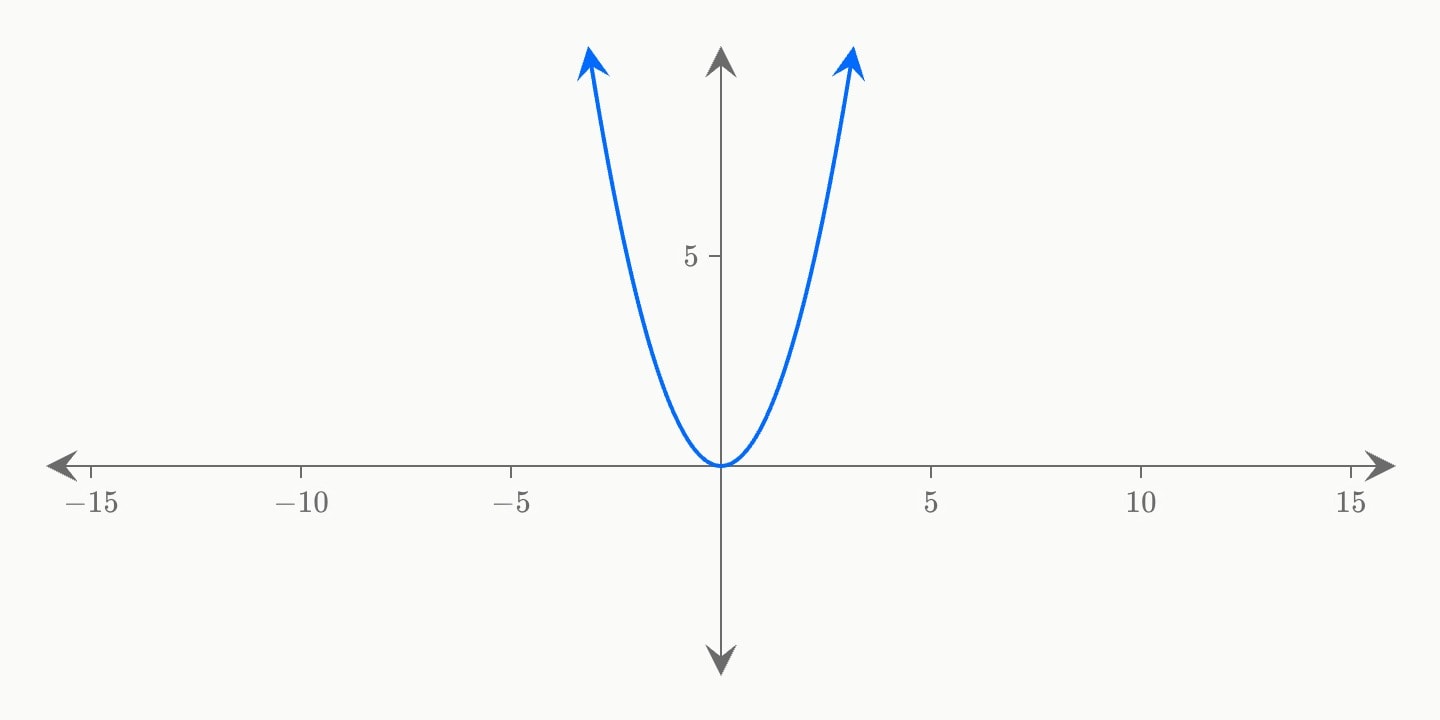
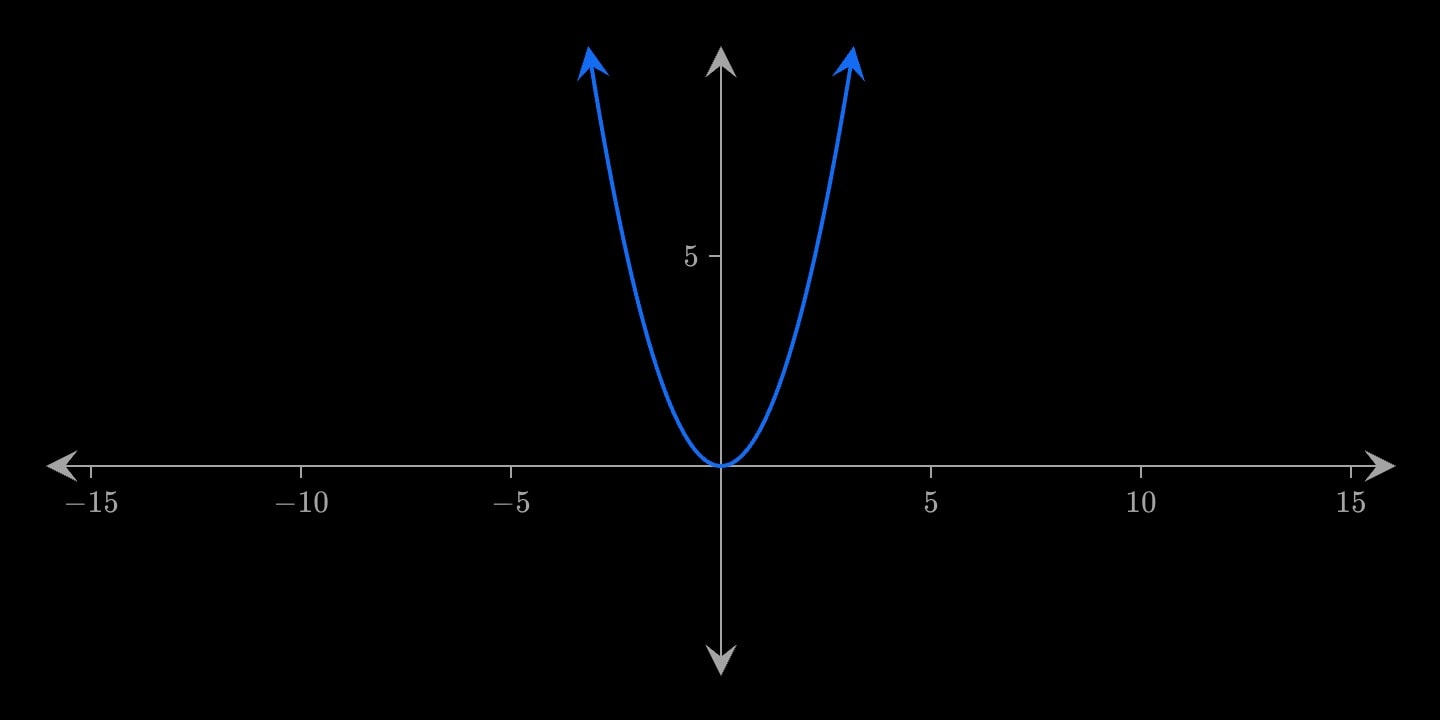
canvas.graph{
    curve(expression: x^2; colour: blue)
}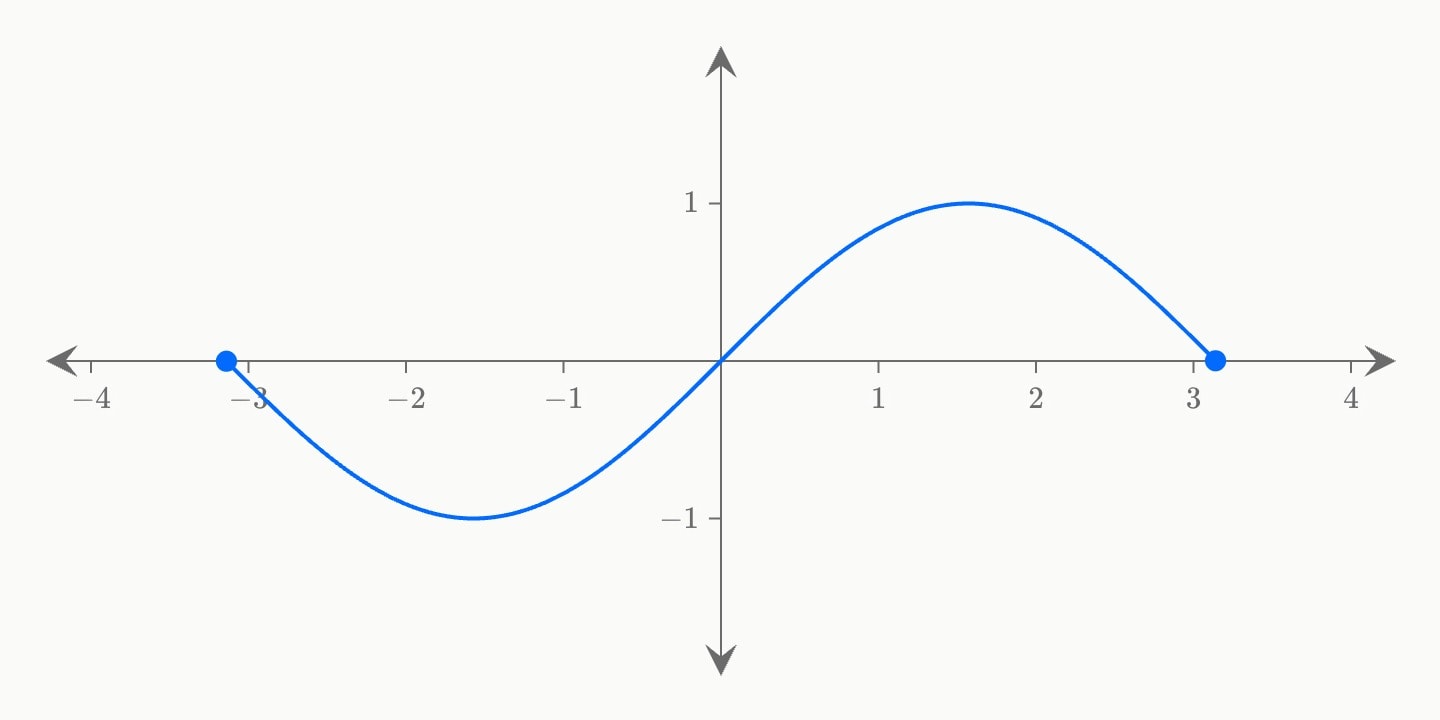
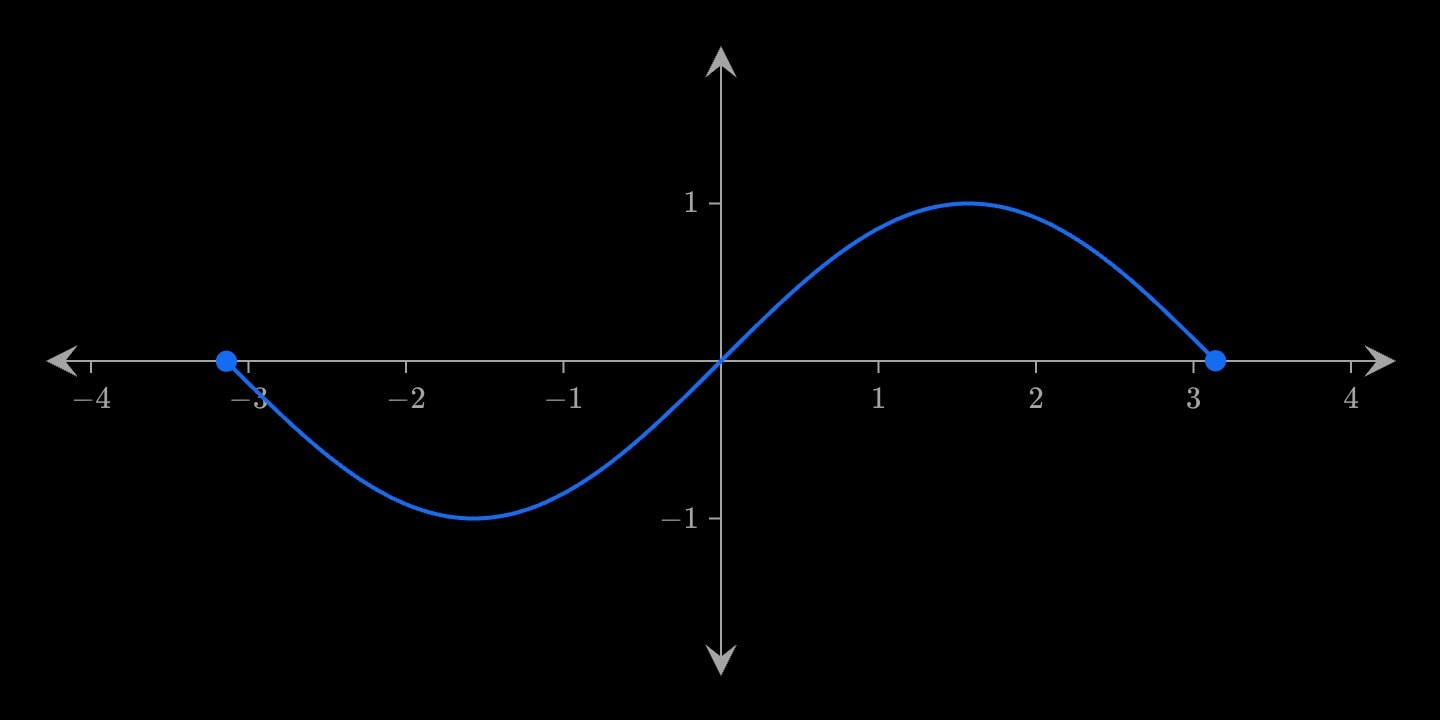
canvas.graph{
    curve(expression: sin(x); domain: [-3.14, 3.14])
}#Notes
- Give a curve a node id —
curve#flight(f: …)— to letcue.tracefollow it withpath: #flight.