point
A single point.
pointOn this page
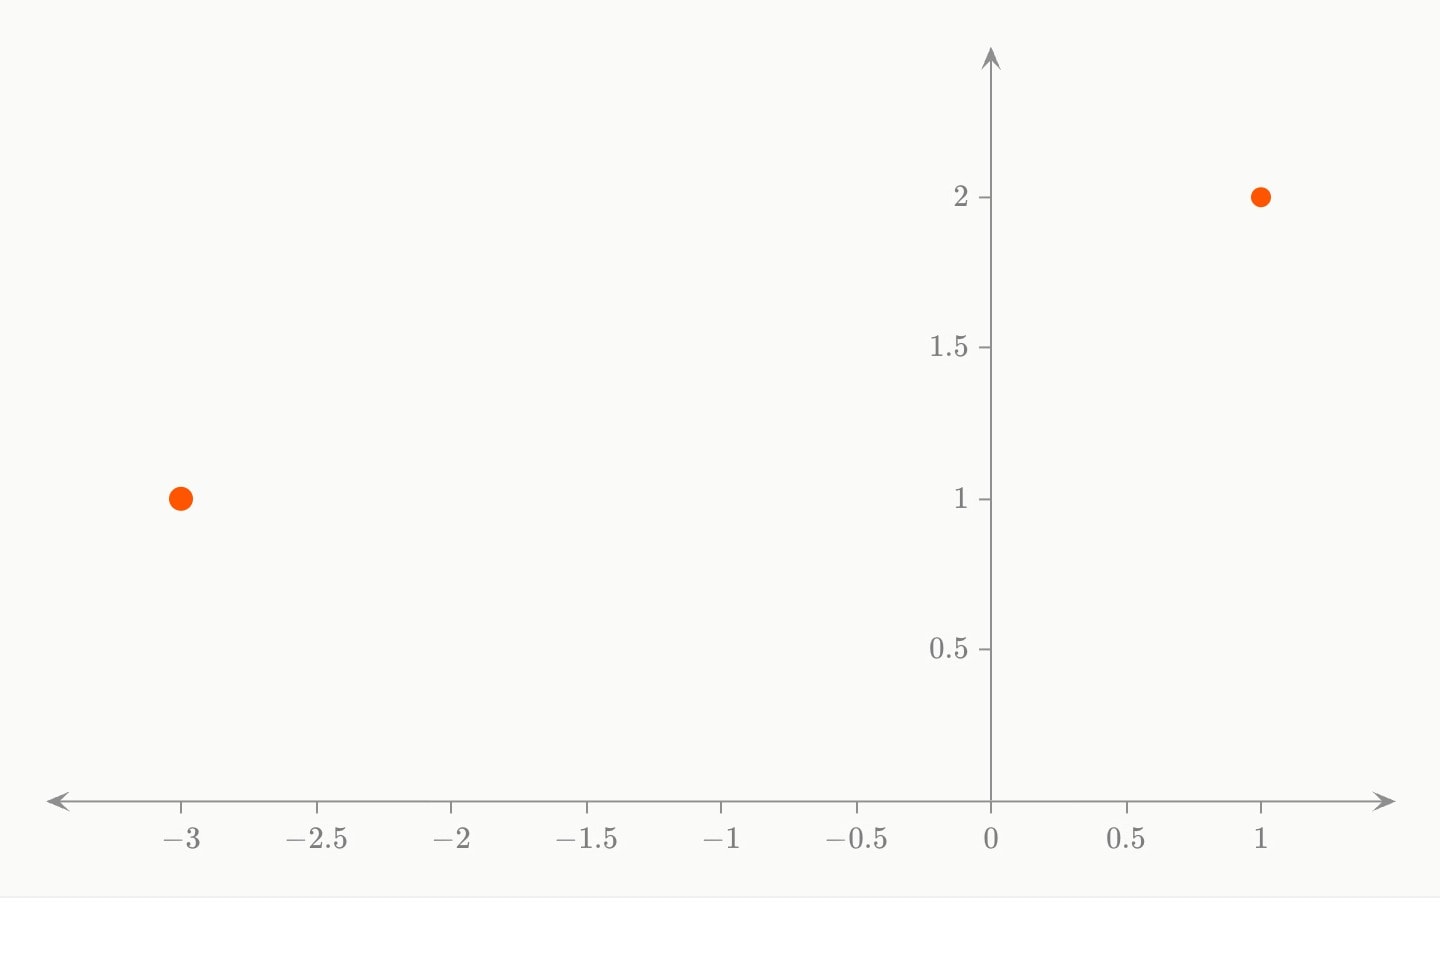
#Attributes
On any plane
sizePoint size.
Default
6colourColour.
paintAlso written:
colorDefault
orangeshapeThe marker drawn, a dot unless written.
circlesquarerectangletrianglestardiamondhexagoncrosstickDefault
circleopacityOpacity.
Default
1labelText drawn beside the element — rich text, so
$maths$ and inline formatting render. Fades and draws with the element.hiddenDeclared but not drawn. Animatable —
hidden: true !cue.to{false}(at: 2) reveals it — and unlike a cue, a hidden element still frames the plot, so the axes do not jump when it appears.Default
falselockKeeps the reader from editing this element on an
editable: graph. Nothing at all on a graph that is not editable.Also written:
lockedDefault
falsetext-sizeText size.
Default
20layerPaint order among the marks: a higher layer is drawn later, on top; equal or omitted, the marks stack in document order, later on top.
groupThe groups this mark belongs to, comma-separated:
group: Early sown, Projected. It is drawn in the colour of the first that has one and the style of the first the graph's key: gives one, unless it writes its own colour: or style, and the footer's key names every group.Only with
xplanexX coordinate, on the number line, the ordinary plane and in space.
Can be written as shorthand:
point:valueOnly with
xyplanexX coordinate, on the number line, the ordinary plane and in space.
Can be written as shorthand:
point:valueyY coordinate, on the ordinary plane and in space.
Only with
argandplanezOn the argand plane, the position as one complex number — a complex expression:
3 + 2i, (3 + 2i)^2, sqrt(13) * e^(i * a), with i the unit and parameters read as complex. Instead of re/im. In space, the z coordinate.reOn the argand plane, the real part of the position, a number; with
im. z: gives both at once.imOn the argand plane, the imaginary part of the position, a number; with
re. z: gives both at once.Only with
polarplanerOn the polar plane, the distance from the origin; with
theta.thetaOn the polar plane, the angle anticlockwise from the right, in radians —
60deg writes it in degrees; with r. On a categorical theta (theta format:), a name.Only with
xyzplanexX coordinate, on the number line, the ordinary plane and in space.
Can be written as shorthand:
point:valueyY coordinate, on the ordinary plane and in space.
zOn the argand plane, the position as one complex number — a complex expression:
3 + 2i, (3 + 2i)^2, sqrt(13) * e^(i * a), with i the unit and parameters read as complex. Instead of re/im. In space, the z coordinate.#Allowed in
#Examples
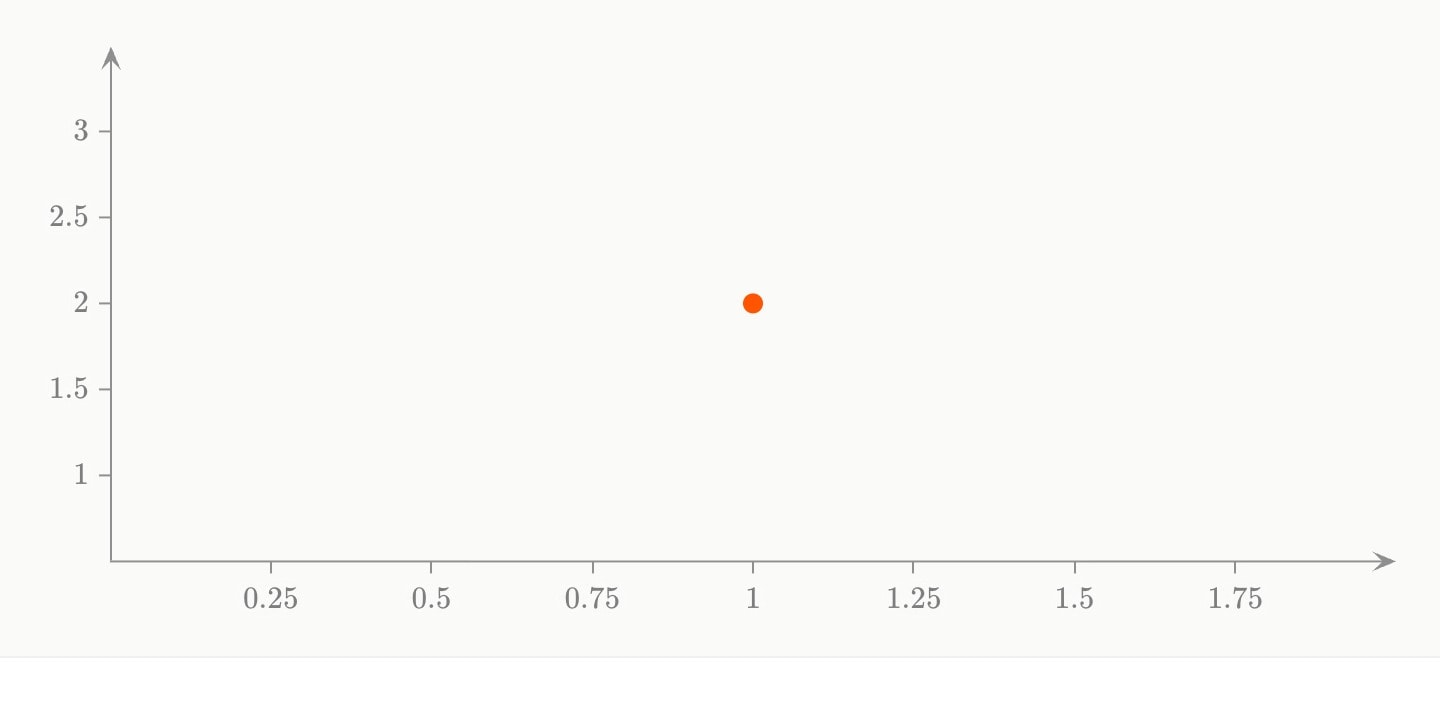
graph{
    point(x: 1; y: 2)
}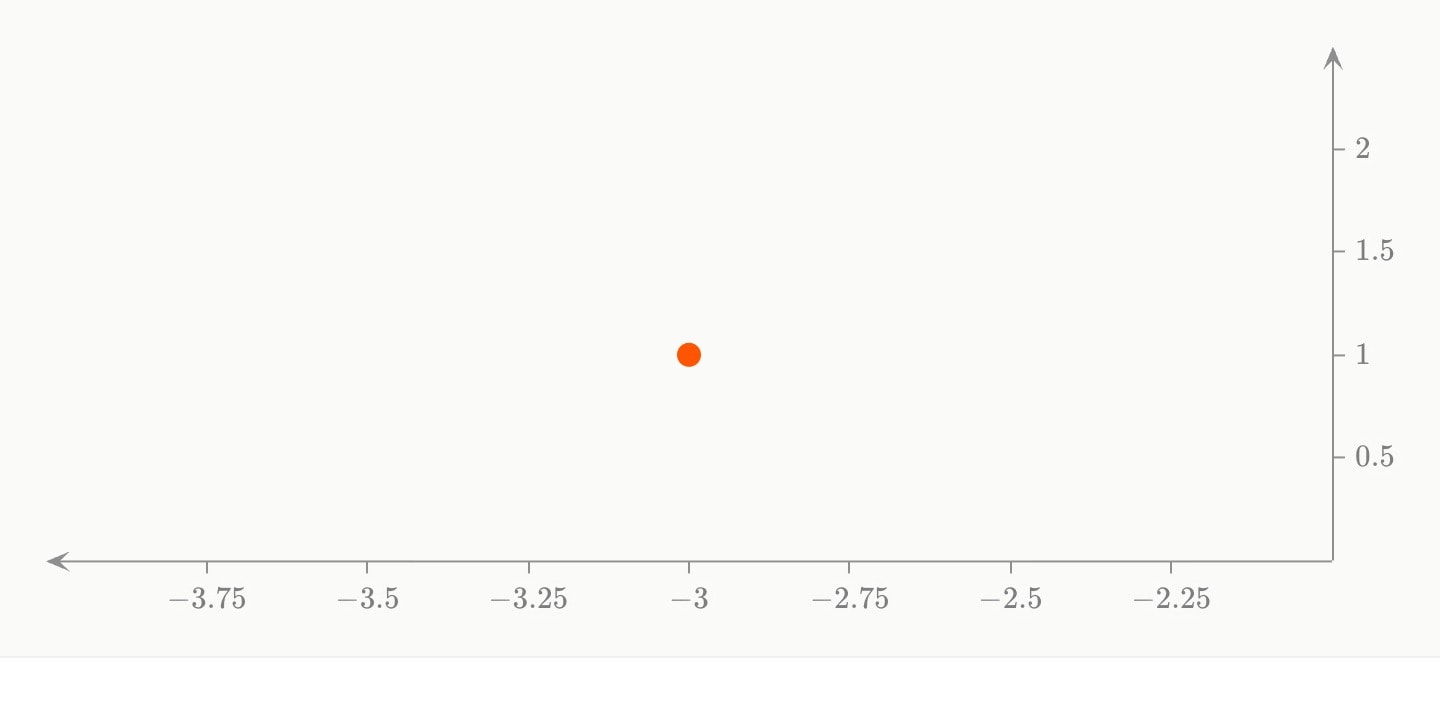
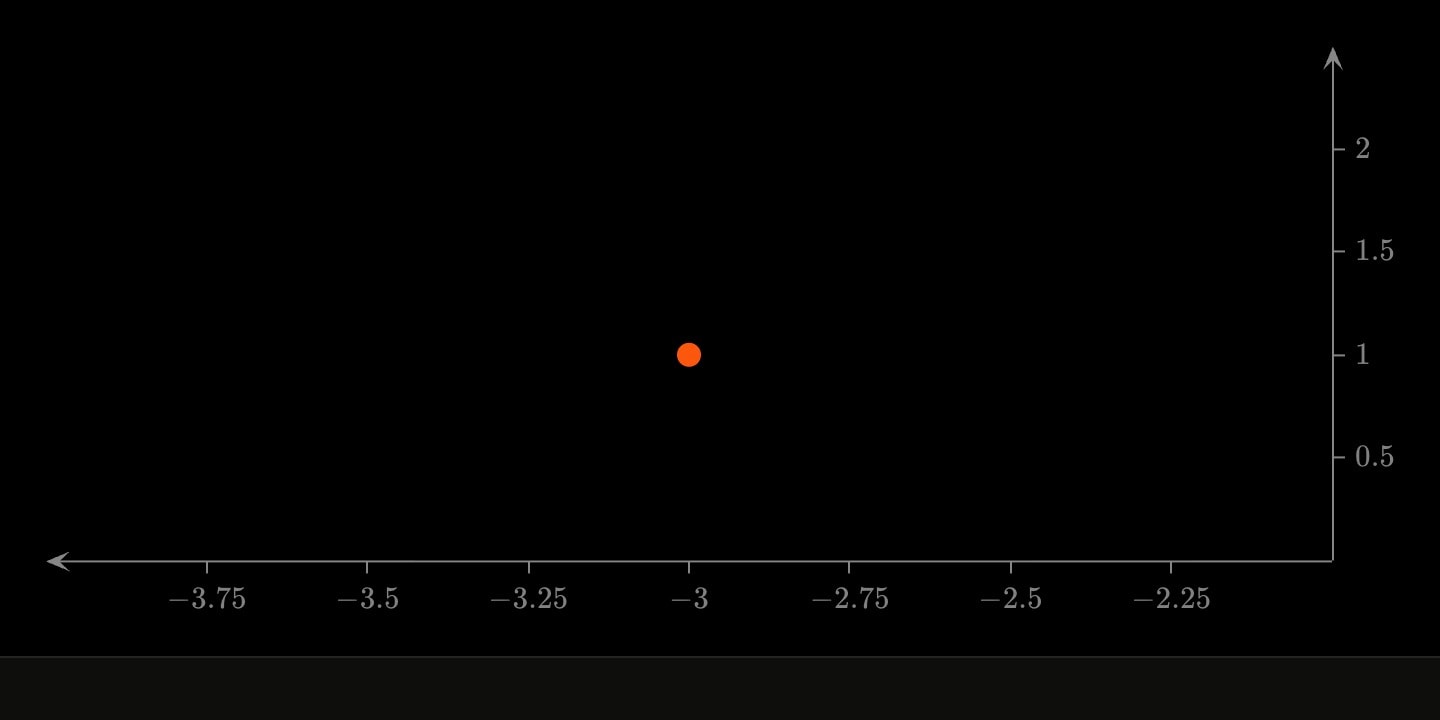
graph{
    point(x: -3; y: 1; size: 8; colour: orange)
}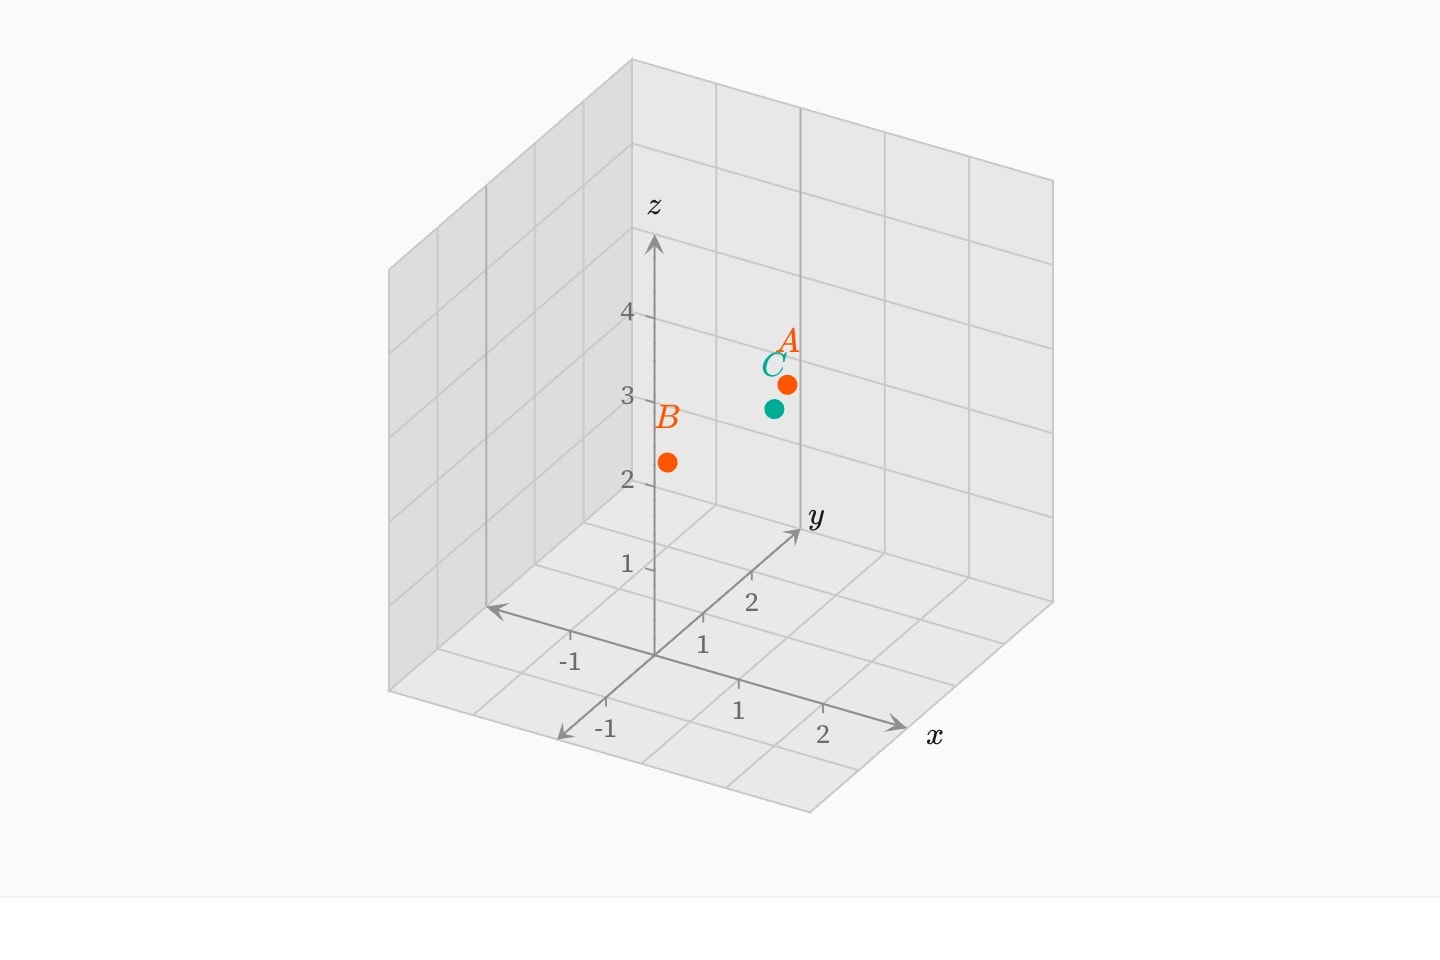
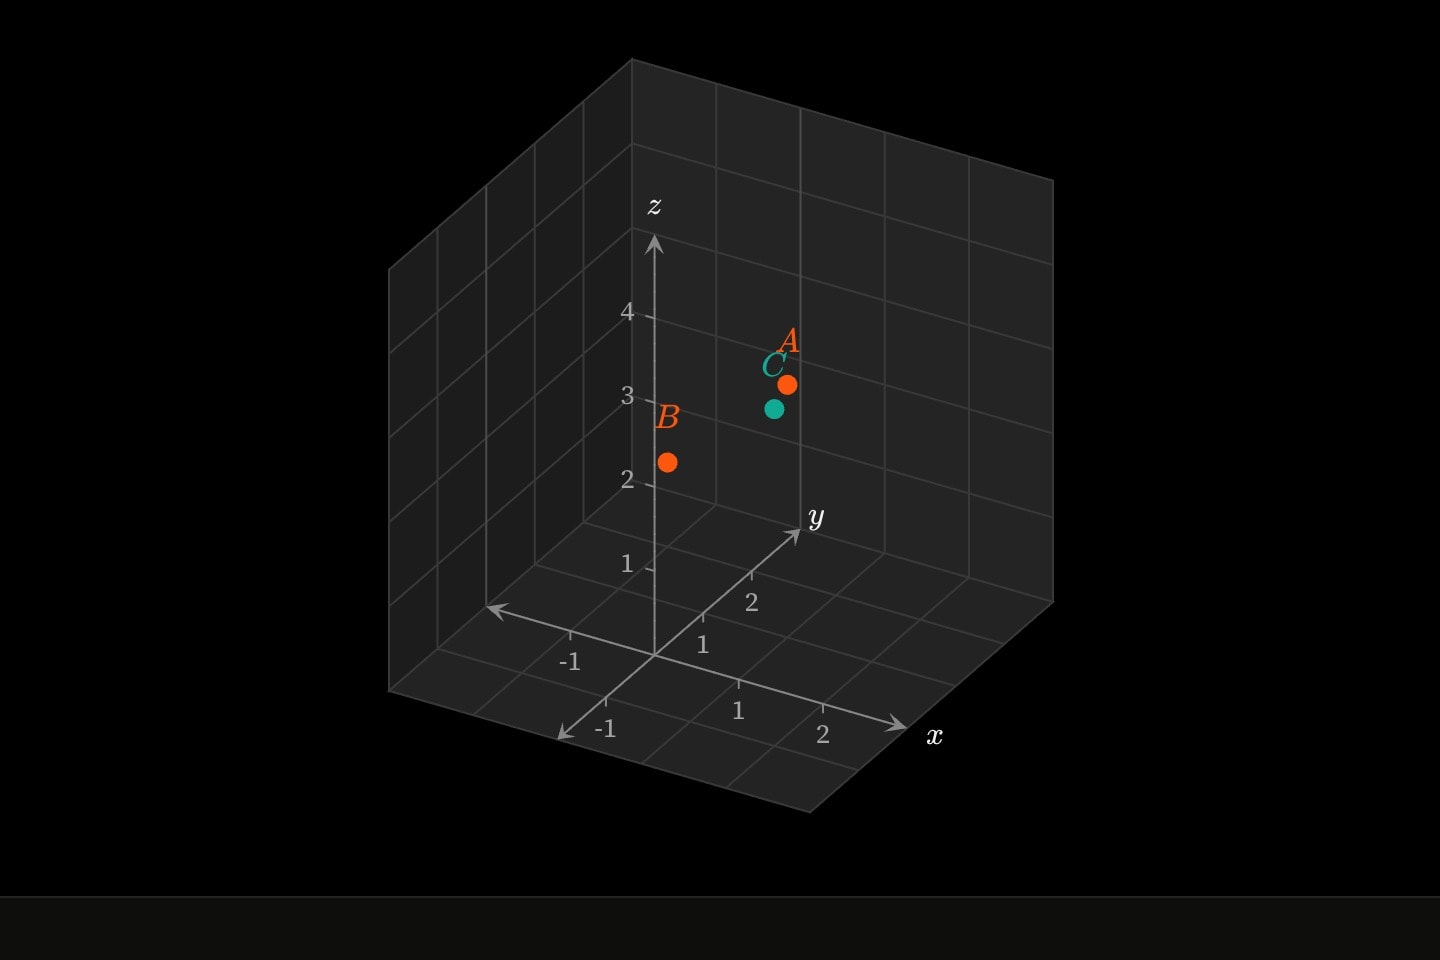
graph:xyz{
    point(x: 1; y: 1; z: 3; label: $A$)
    point(x: -1; y: 2; z: 1; label: $B$; colour: orange)
    point(x: 2; y: -1; z: 4; label: $C$; colour: teal)
}(
    x domain: [-2, 3]
    y domain: [-2, 3]
    z domain: [0, 5]
)#Notes
- For many points at once,
scattertakes one coordinate list.