scatter
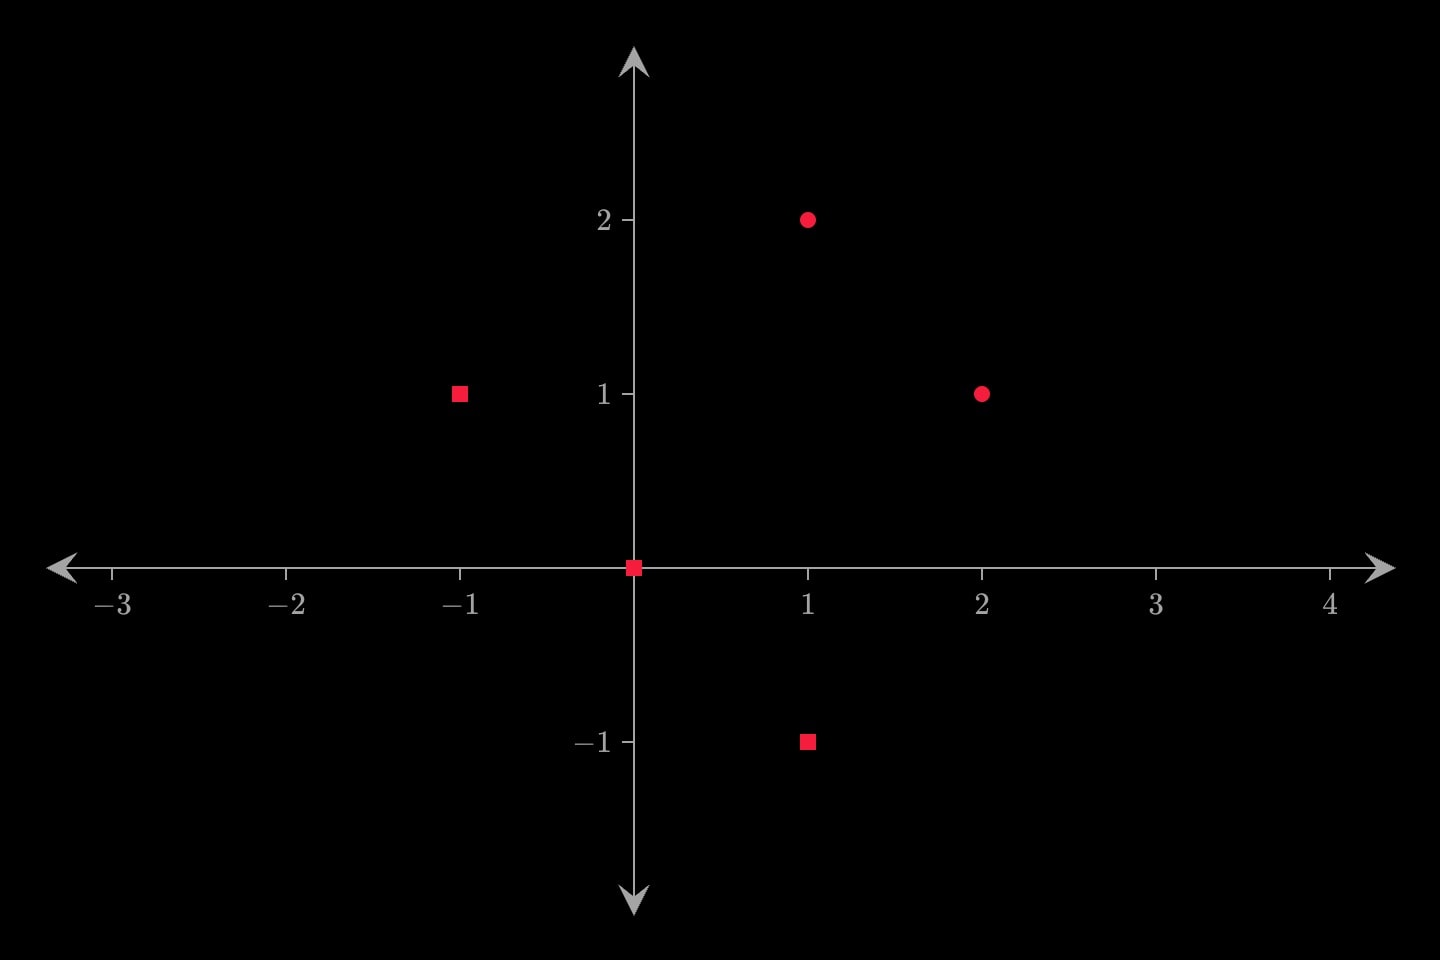
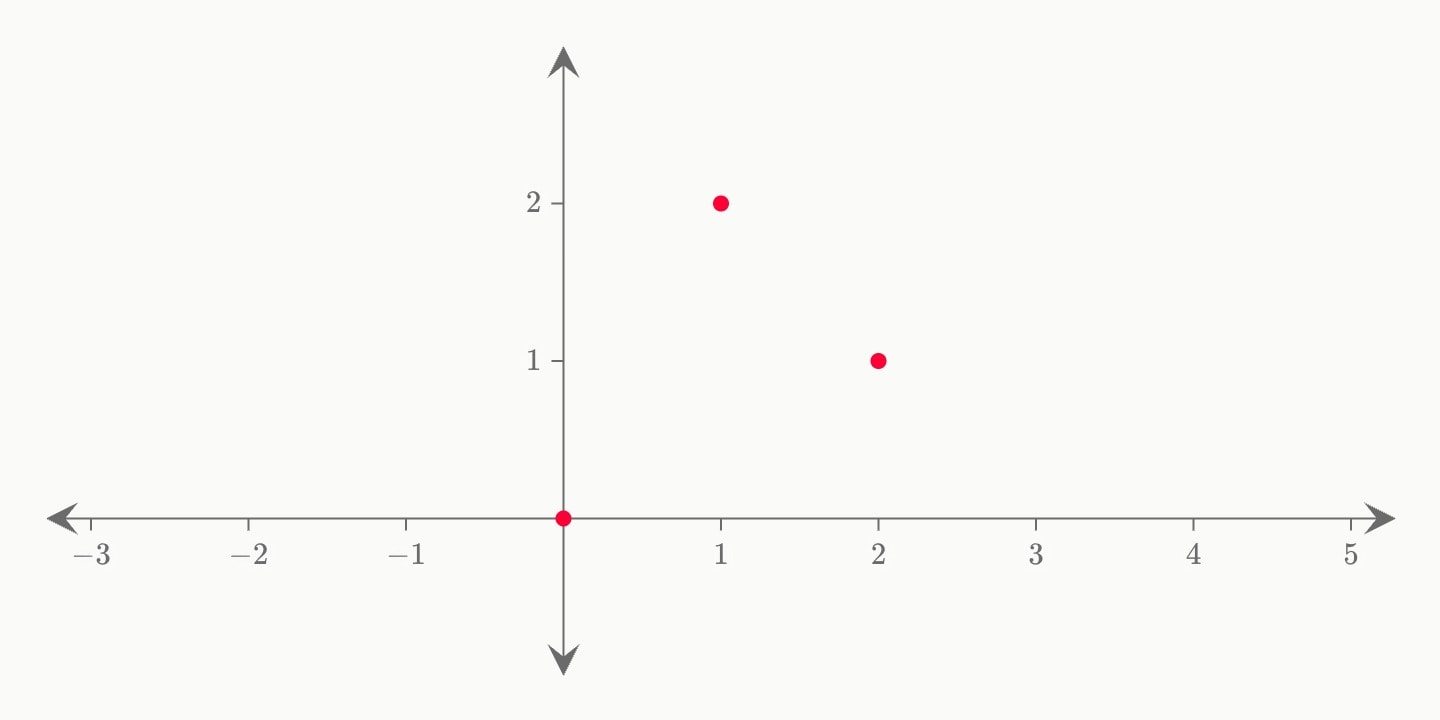
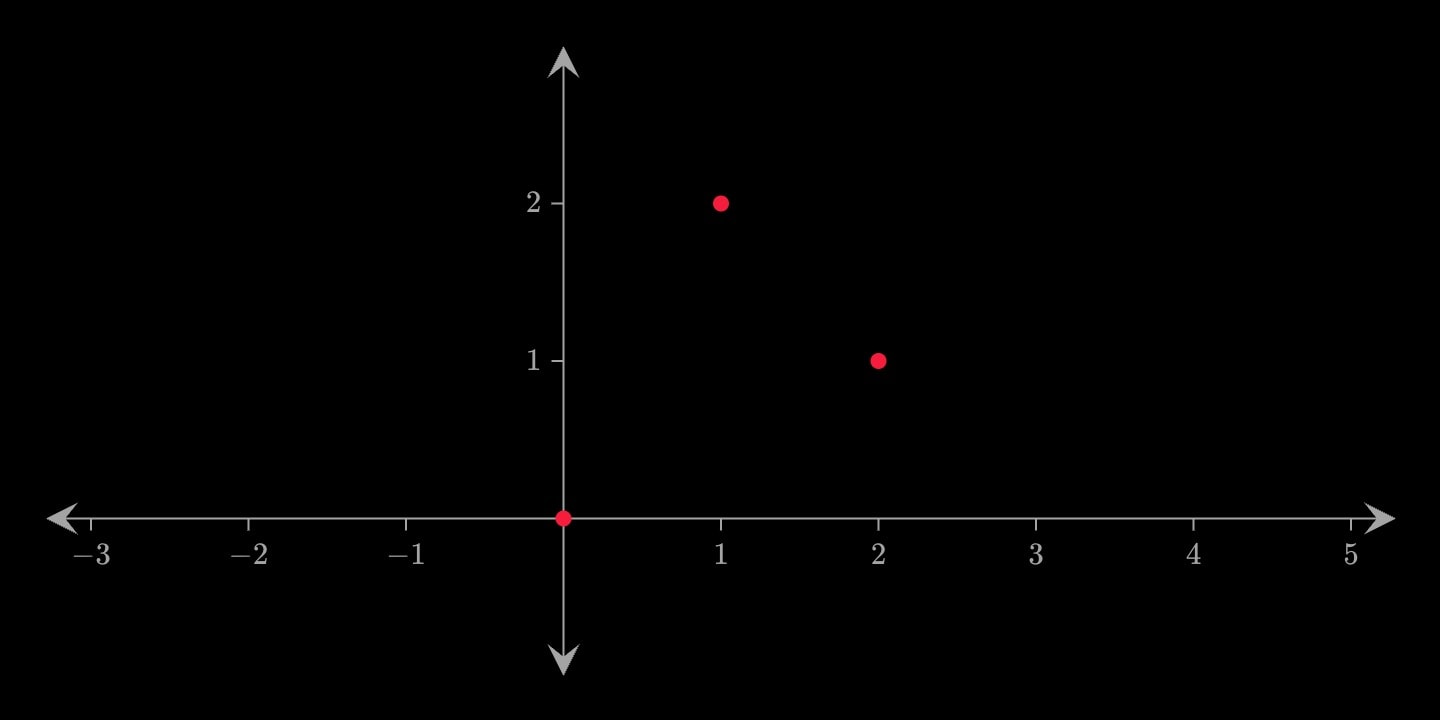
A set of points, one axis per attribute: scatter(x: 0, 1, 2; y: 0, 2, 1) — or dataset columns, scatter(x: #islands.area; y: #islands.species). One shape, size and colour apply to all of them. A fit in the same environment fits this data. A scatter STANDS when it has a line to lay its dots out about, as a boxplot does: in a lane above the number line, where it is a dot plot; at its on: on a plane, as a strip of one sample; or, written with both coordinates and one axis ruled in names, at every name at once, each reading at the name in its row. layout: lays the dots out about that line — stacked, swarmed or jittered — and a scatter and a box of the same readings at the same place share one slot, so the box lands on the dots it summarises. split: colours the readings on either side of a value apart, the diverging picture of paired comparisons.
scatter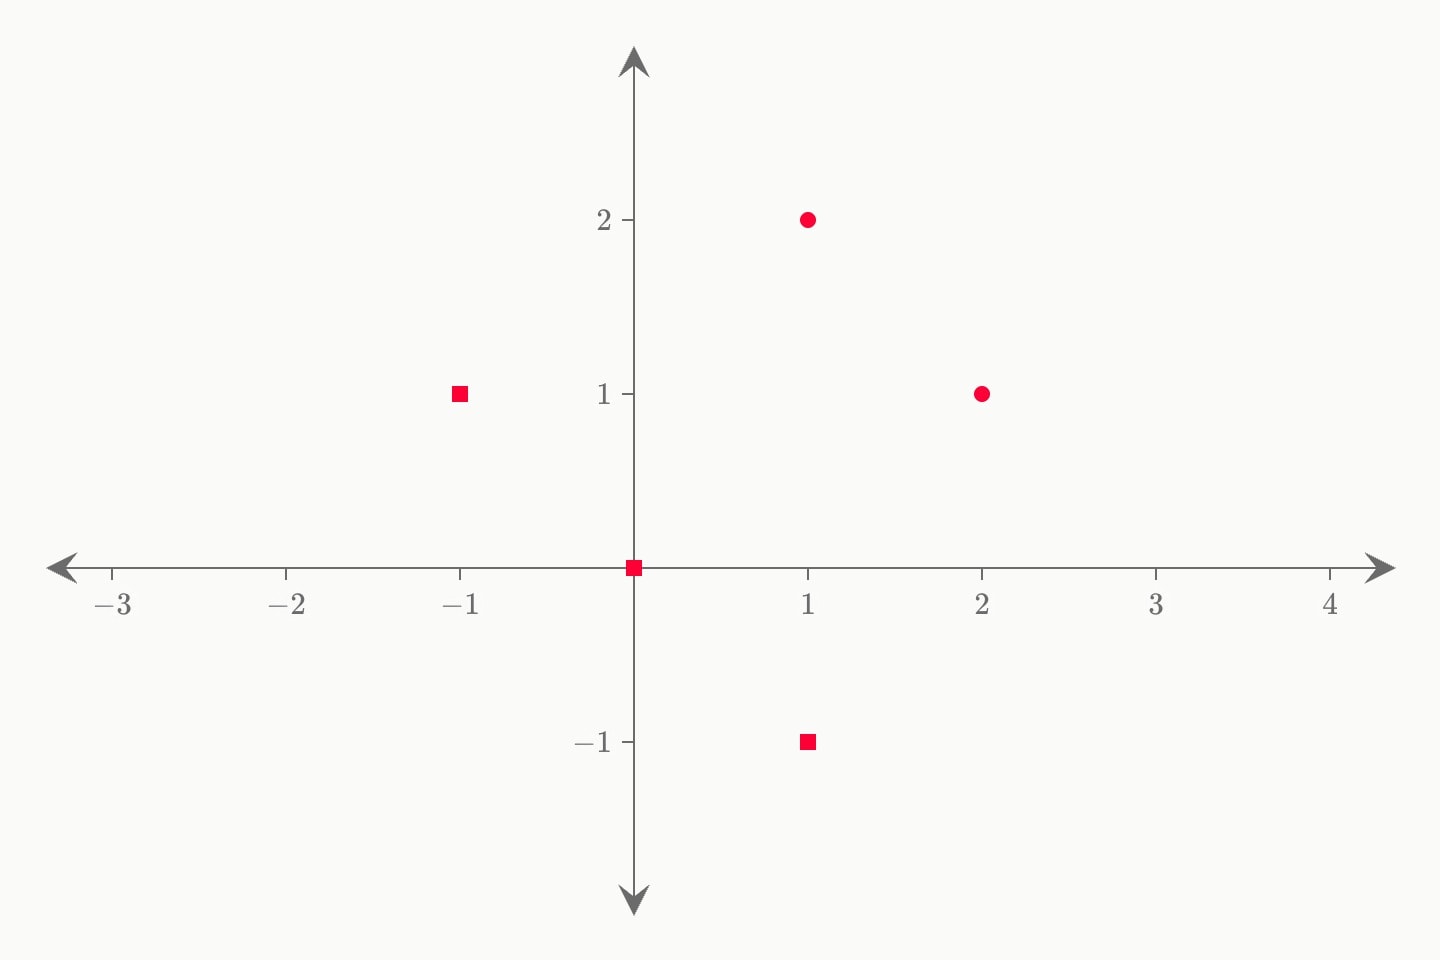
#Readings
A scatter takes its readings one axis per attribute, paired by position — scatter(x: 1, 2, 3; y: 2.0, 2.4, 3.1) — and either attribute binds a dataset column directly: scatter(x: #islands.area; y: #islands.species). On the number line the same readings are a distribution: scatter(x: 2, 3, 3, 4) stacks equal values into a dot plot.
#Laying out the dots
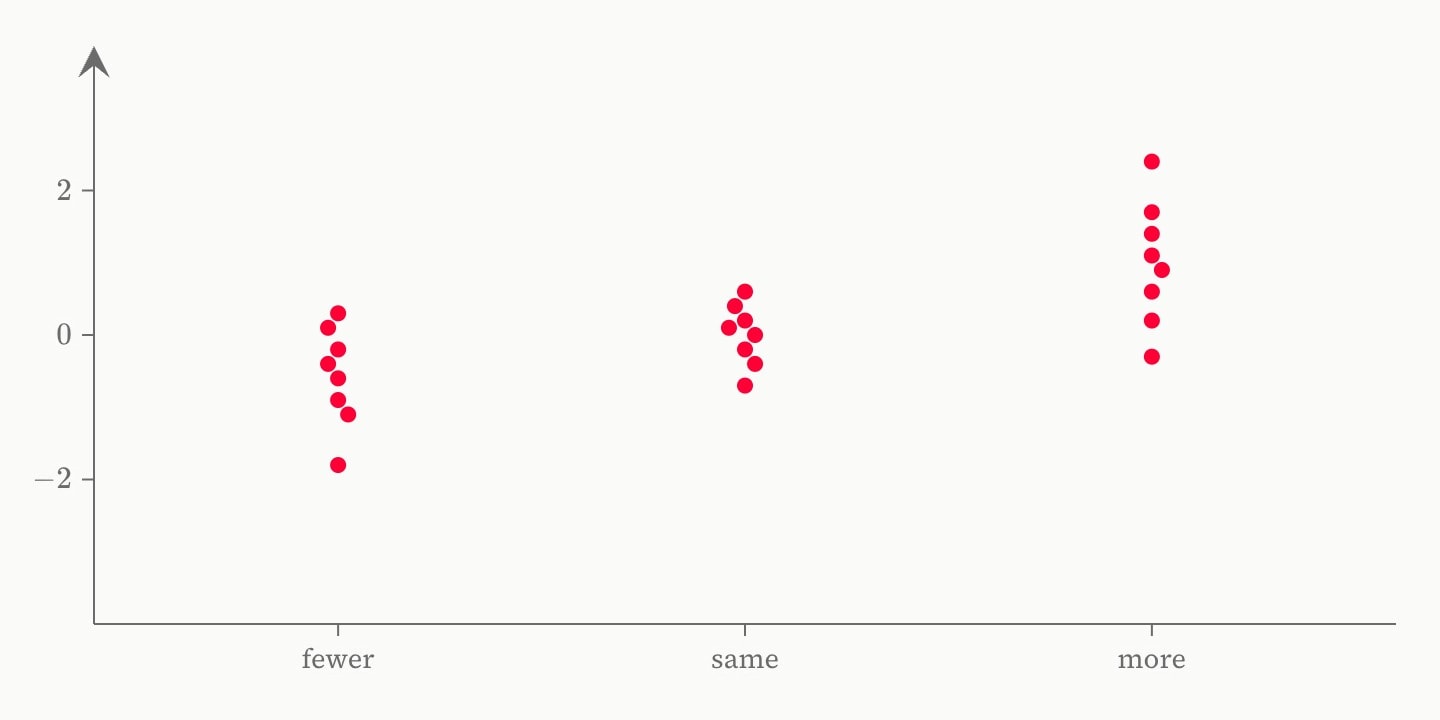
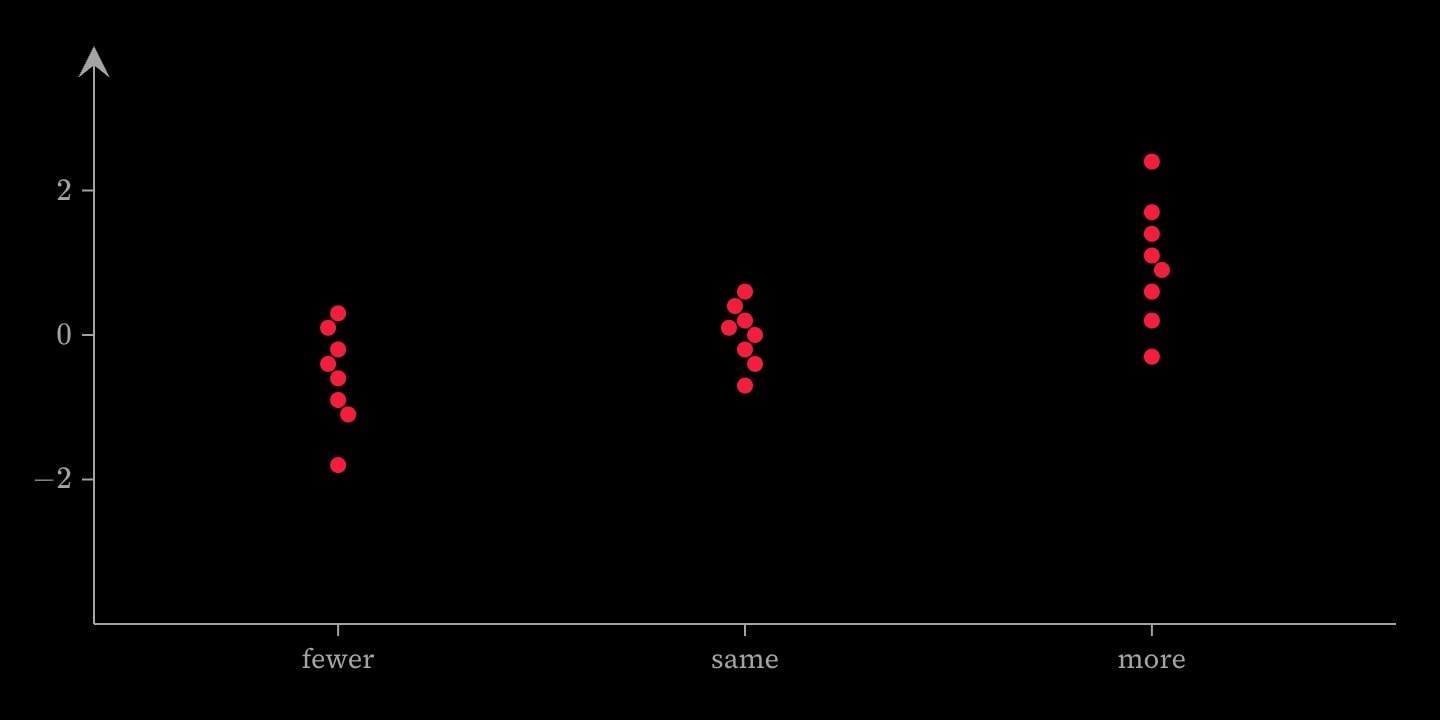
Where a scatter stands — a lane on the number line, or a place given by on: — layout says how its dots are laid out: stack, the number line's default; swarm, which puts each dot at the nearest place across the line where it touches no other, so readings that are merely close spread as well as ones that are equal and the outline of the swarm is the shape of the distribution; jitter, a settled offset for each dot, which is what a sample of thousands has to be drawn as; or none. A scatter standing at a place on a plane is swarmed unless layout says otherwise. width is the share of the lane a swarm or a jitter may spread across. A swarm too crowded for its width — a column of tied readings, say — draws its dots smaller until it fits, down to half the size asked for, before it lets any overlap.
A scatter over two numeric axes stands nowhere, so it takes no stack or swarm; layout: jitter there nudges both coordinates, by at most half the smallest gap between the values on each axis, so tied readings come apart without any dot crossing the place a different reading would have been. The offsets come from the graph's seed.
#Colouring by a threshold
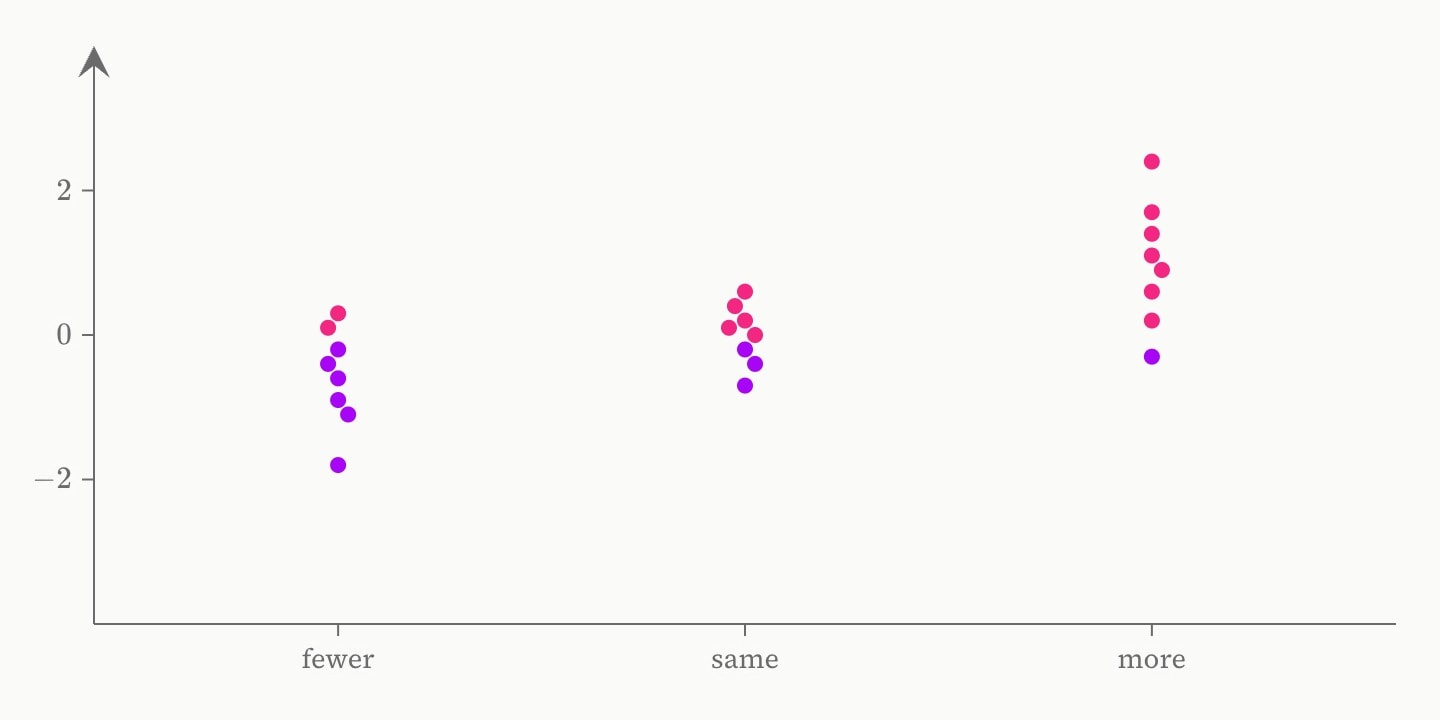
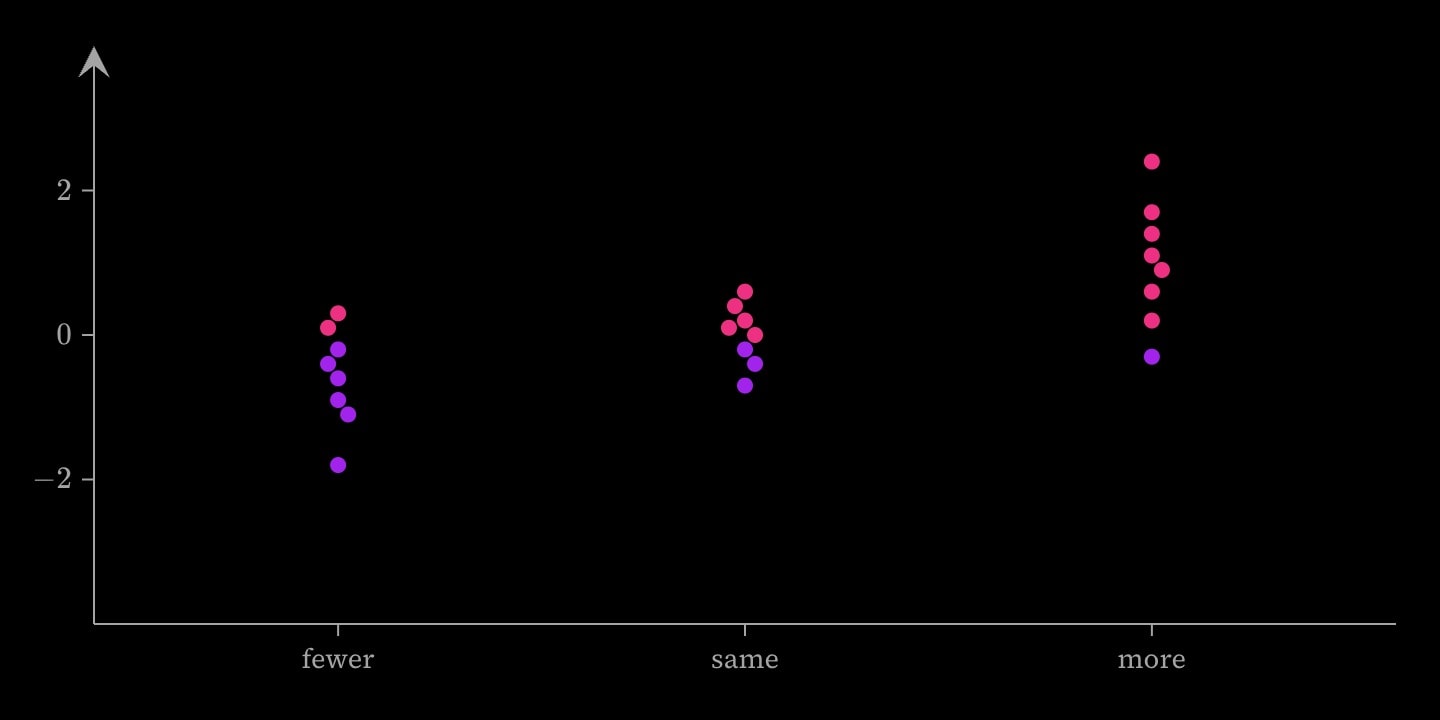
Given a split, a scatter colours the readings at or above it in split colour and leaves the rest in colour — the diverging picture of paired comparisons, every one on the side of no difference it fell, read from the reading itself so a swarmed or jittered dot keeps the colour of its value. The statistics pack's effect-strip draws that whole chart, the baseline and both named sides included.
canvas.graph:xy{
    axis.label(x: 0; label: no change; colour: grey; line)
    boxplot(x: #studies.change; y: #studies.impact; colour: grey)
    scatter(x: #studies.change; y: #studies.impact; colour: purple; split: 0; split colour: pink)
}(
    x axis label: change per kilogram of food (%)
)#Error bars
A scatter takes error and error-x, one half-width per reading — a column of uncertainties bound whole draws a capped bar through every dot, and the frame grows to hold the caps.
#Attributes
sliceerrorerror-yerror-xshapecirclesquarerectangletrianglestardiamondhexagoncrosscirclesize6colourbluelight-bluedark-blueredlight-reddark-redorangelight-orangedark-orangeyellowlight-yellowdark-yellowteallight-tealdark-tealgreenlight-greendark-greenpinklight-pinkdark-pinkpurplelight-purpledark-purplegreylight-greydark-greyneutralhex(…)rgb(…)colorredcolourssplit:, which is the other way of colouring a dot by which one it is.colorsopacity1label$maths$ and inline formatting render. Fades and draws with the element.hiddenhidden: true !cue.to{false}(at: 2) reveals it — and unlike a cue, a hidden element still frames the plot, so the axes do not jump when it appears.falselockeditable: graph. Nothing at all on a graph that is not editable.lockedfalselayerz: before the argand plane took that letter for its coordinate.xplanex#islands.area). A column of names reads against a categorical axis (x format:, or the axis’s auto rule); an ISO date column reads as fractional years (2024-03-15 → ≈2024.2), and auto labels them in years. Paired with y by position; a pair either axis cannot read as a number is dropped whole.scatter:valuelayoutstack stacks equal readings, so the height of a column is the count: the dot plot. swarm puts each dot at the nearest place across the line where it touches no other, so readings that are merely close spread as well as equal ones and the outline is the shape of the distribution. jitter gives each dot a settled offset within width:; on a scatter that does not stand it nudges both coordinates instead, by at most half the smallest gap between the values on each axis. none puts every dot on the line. auto, the default, is a stack on the number line, a swarm beside a box of the same readings or at a name or an on:, and none on an ordinary cloud. stack and swarm are refused on a scatter that stands nowhere, and everything but auto and none on the polar plane. Animatable: a !cue.to from one layout to another glides each dot from where the old layout put it to where the new one does.autononestackswarmjitterautowidthboxplot's width: is a share of, so a box and its dots are measured against one thing. A swarm that needs more draws its dots smaller until it fits, one size for the whole mark and never below half the size asked for, and only then overlaps at its edge rather than spilling into the next name. On an ordinary cloud, the share of the half-gap jitter may nudge a dot by. Nothing to stack or none.0.8splitcolour:, readings at or above it take split-colour:. split: 0 beside a purple and a pink is the diverging picture, every comparison on the side of no difference it fell. Measured on the axis readings are measured along: the line a standing scatter is laid out about, x on the number line, y on an ordinary cloud. Read from the reading itself, so a jittered dot stays the colour of its value, and each error bar takes its reading's colour. Refused without split-colour:, and on the polar plane.split-coloursplit:. Refused without a split:.bluelight-bluedark-blueredlight-reddark-redorangelight-orangedark-orangeyellowlight-yellowdark-yellowteallight-tealdark-tealgreenlight-greendark-greenpinklight-pinkdark-pinkpurplelight-purpledark-purplegreylight-greydark-greyneutralhex(…)rgb(…)split-colorxyplanex#islands.area). A column of names reads against a categorical axis (x format:, or the axis’s auto rule); an ISO date column reads as fractional years (2024-03-15 → ≈2024.2), and auto labels them in years. Paired with y by position; a pair either axis cannot read as a number is dropped whole.scatter:valueyx by position.onboxplot's on: takes. scatter(y: #trial.control; on: control) is the readings up the y axis, all standing at the name control on x, and a name there joins the axis's names. A boxplot with the same readings and the same on: shares the strip's slot. Refused on the number line, which has no second axis, and on a scatter that writes both coordinates, whose dots stand where their readings put them.layoutstack stacks equal readings, so the height of a column is the count: the dot plot. swarm puts each dot at the nearest place across the line where it touches no other, so readings that are merely close spread as well as equal ones and the outline is the shape of the distribution. jitter gives each dot a settled offset within width:; on a scatter that does not stand it nudges both coordinates instead, by at most half the smallest gap between the values on each axis. none puts every dot on the line. auto, the default, is a stack on the number line, a swarm beside a box of the same readings or at a name or an on:, and none on an ordinary cloud. stack and swarm are refused on a scatter that stands nowhere, and everything but auto and none on the polar plane. Animatable: a !cue.to from one layout to another glides each dot from where the old layout put it to where the new one does.autononestackswarmjitterautowidthboxplot's width: is a share of, so a box and its dots are measured against one thing. A swarm that needs more draws its dots smaller until it fits, one size for the whole mark and never below half the size asked for, and only then overlaps at its edge rather than spilling into the next name. On an ordinary cloud, the share of the half-gap jitter may nudge a dot by. Nothing to stack or none.0.8splitcolour:, readings at or above it take split-colour:. split: 0 beside a purple and a pink is the diverging picture, every comparison on the side of no difference it fell. Measured on the axis readings are measured along: the line a standing scatter is laid out about, x on the number line, y on an ordinary cloud. Read from the reading itself, so a jittered dot stays the colour of its value, and each error bar takes its reading's colour. Refused without split-colour:, and on the polar plane.split-coloursplit:. Refused without a split:.bluelight-bluedark-blueredlight-reddark-redorangelight-orangedark-orangeyellowlight-yellowdark-yellowteallight-tealdark-tealgreenlight-greendark-greenpinklight-pinkdark-pinkpurplelight-purpledark-purplegreylight-greydark-greyneutralhex(…)rgb(…)split-colorargandplanez1 + i, 2 - i, -3i, a bare number a real), or a column of complex literals bound whole (#roots.z). Instead of re/im.reim by position.imre by position.onboxplot's on: takes. scatter(y: #trial.control; on: control) is the readings up the y axis, all standing at the name control on x, and a name there joins the axis's names. A boxplot with the same readings and the same on: shares the strip's slot. Refused on the number line, which has no second axis, and on a scatter that writes both coordinates, whose dots stand where their readings put them.layoutstack stacks equal readings, so the height of a column is the count: the dot plot. swarm puts each dot at the nearest place across the line where it touches no other, so readings that are merely close spread as well as equal ones and the outline is the shape of the distribution. jitter gives each dot a settled offset within width:; on a scatter that does not stand it nudges both coordinates instead, by at most half the smallest gap between the values on each axis. none puts every dot on the line. auto, the default, is a stack on the number line, a swarm beside a box of the same readings or at a name or an on:, and none on an ordinary cloud. stack and swarm are refused on a scatter that stands nowhere, and everything but auto and none on the polar plane. Animatable: a !cue.to from one layout to another glides each dot from where the old layout put it to where the new one does.autononestackswarmjitterautowidthboxplot's width: is a share of, so a box and its dots are measured against one thing. A swarm that needs more draws its dots smaller until it fits, one size for the whole mark and never below half the size asked for, and only then overlaps at its edge rather than spilling into the next name. On an ordinary cloud, the share of the half-gap jitter may nudge a dot by. Nothing to stack or none.0.8splitcolour:, readings at or above it take split-colour:. split: 0 beside a purple and a pink is the diverging picture, every comparison on the side of no difference it fell. Measured on the axis readings are measured along: the line a standing scatter is laid out about, x on the number line, y on an ordinary cloud. Read from the reading itself, so a jittered dot stays the colour of its value, and each error bar takes its reading's colour. Refused without split-colour:, and on the polar plane.split-coloursplit:. Refused without a split:.bluelight-bluedark-blueredlight-reddark-redorangelight-orangedark-orangeyellowlight-yellowdark-yellowteallight-tealdark-tealgreenlight-greendark-greenpinklight-pinkdark-pinkpurplelight-purpledark-purplegreylight-greydark-greyneutralhex(…)rgb(…)split-color#Allowed in
#Examples
canvas.graph{
    scatter(x: 0, 1, 2; y: 0, 2, 1)
}
canvas.graph{
    scatter(x: #studies.change; y: #studies.impact; layout: swarm)
}
canvas.graph{
    scatter(x: #studies.change; y: #studies.impact; colour: purple; split: 0; split-colour: pink)
}