polygon
A closed shape whose outline is its x: and y: vertex series, paired by position. The named shapes take a position and a size; a polygon takes its outline directly.
polygonOnly with
xyargandpolarplane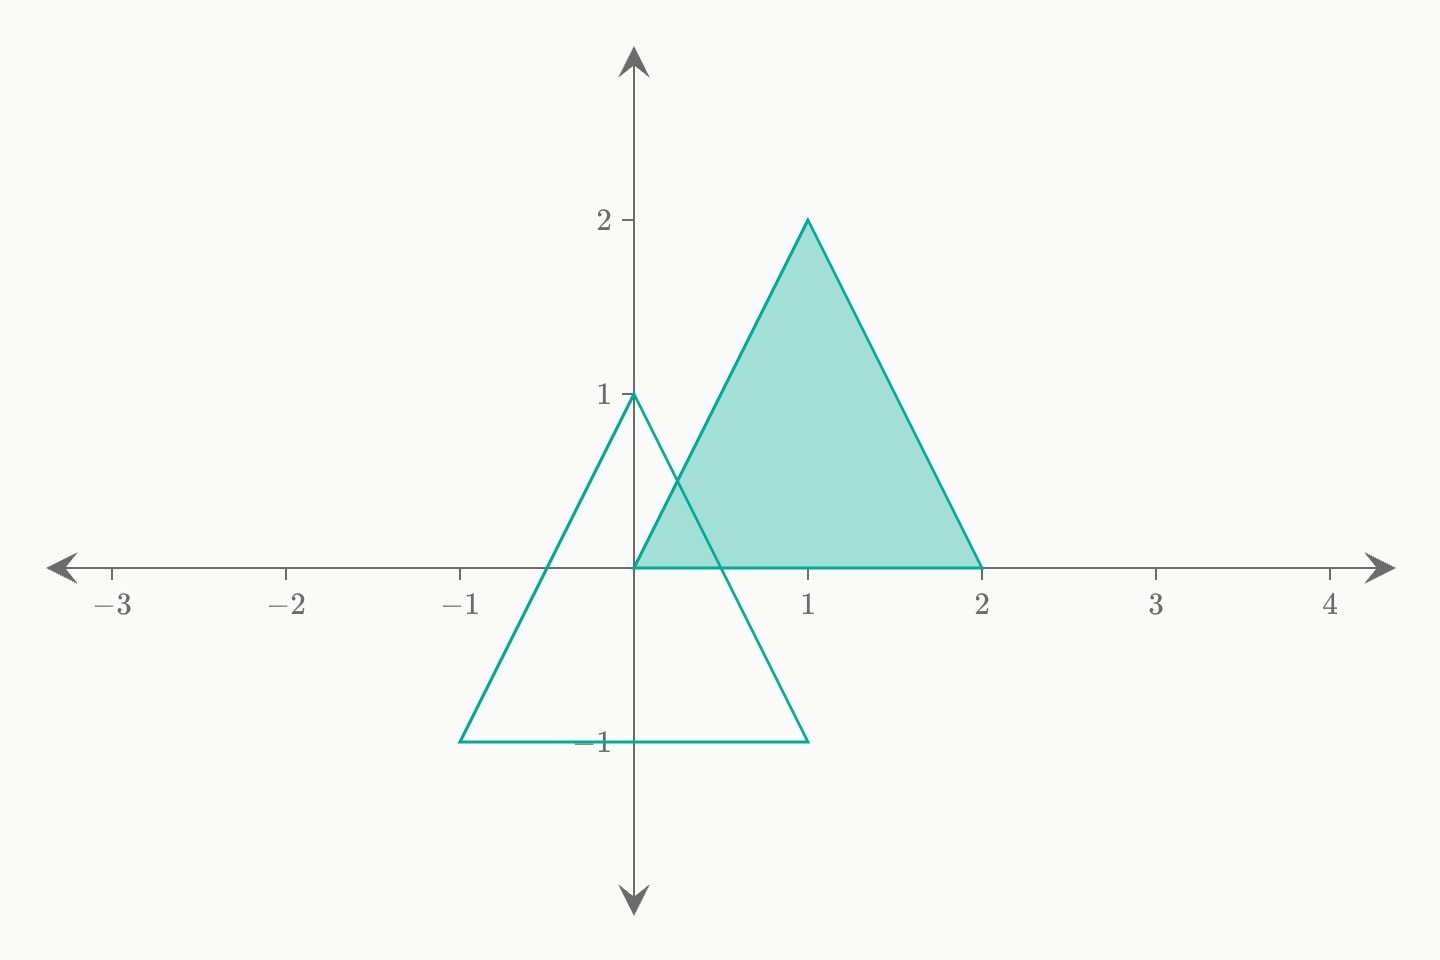
#Attributes
On any plane
sliceThe column this mark is SLICED by — long-format data, one row per thing per slice, showing the one the scene's parameter over that column holds. A column with a number line interpolates, so a reader stopped between two values sees half way; a column of names selects the rows carrying the name they picked.
fillFill polygon.
Also written:
filledDefault
truecolourColour.
bluelight-bluedark-blueredlight-reddark-redorangelight-orangedark-orangeyellowlight-yellowdark-yellowteallight-tealdark-tealgreenlight-greendark-greenpinklight-pinkdark-pinkpurplelight-purpledark-purplegreylight-greydark-greyneutralhex(…)rgb(…)colorDefault
tealopacityOpacity.
Default
1dashedDraws the outline dashed. What it is for is the shape that is not there: where a figure was before it moved, a region a constraint rules out, a construction that explains the drawing without being part of it.
Default
falseinterpolateHow the outline gets from one vertex to the next:
linear for straight sides, bezier for a closed round outline, on the same midpoint handles as the line’s. No step — a staircase is a reading against x, and a closed outline is not one.linearbezierAlso written:
interpolationDefault
linearlabelText drawn beside the element — rich text, so
$maths$ and inline formatting render. Fades and draws with the element.hiddenDeclared but not drawn. Animatable —
hidden: true !cue.to{false}(at: 2) reveals it — and unlike a cue, a hidden element still frames the plot, so the axes do not jump when it appears.Default
falselockKeeps the reader from editing this element on an
editable: graph. Nothing at all on a graph that is not editable.Also written:
lockedDefault
falsetext-sizeText size.
Default
20layerPaint order among the marks: a higher layer is drawn later, on top; equal or omitted, the marks stack in document order (later on top). Written
z: before the argand plane took that letter for its coordinate.Only with
xyplaneOnly with
argandplanezOn the argand plane, the readings as complex numbers: written out (
1 + i, 2 - i, -3i, a bare number a real), or a column of complex literals bound whole (#roots.z). Instead of re/im.reOn the argand plane, the readings' real parts, one per reading — numbers written out or a column — paired with
im by position.imOn the argand plane, the readings' imaginary parts, paired with
re by position.#Allowed in
#Examples
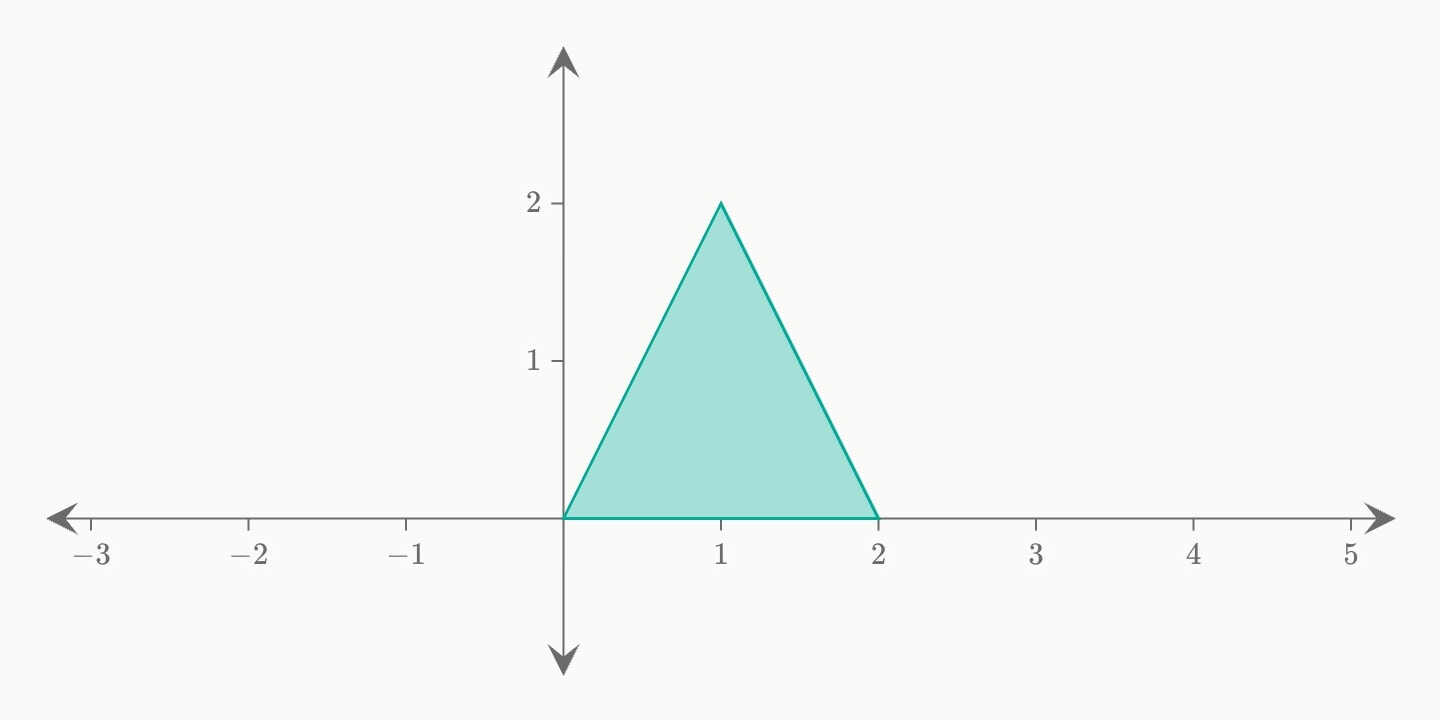
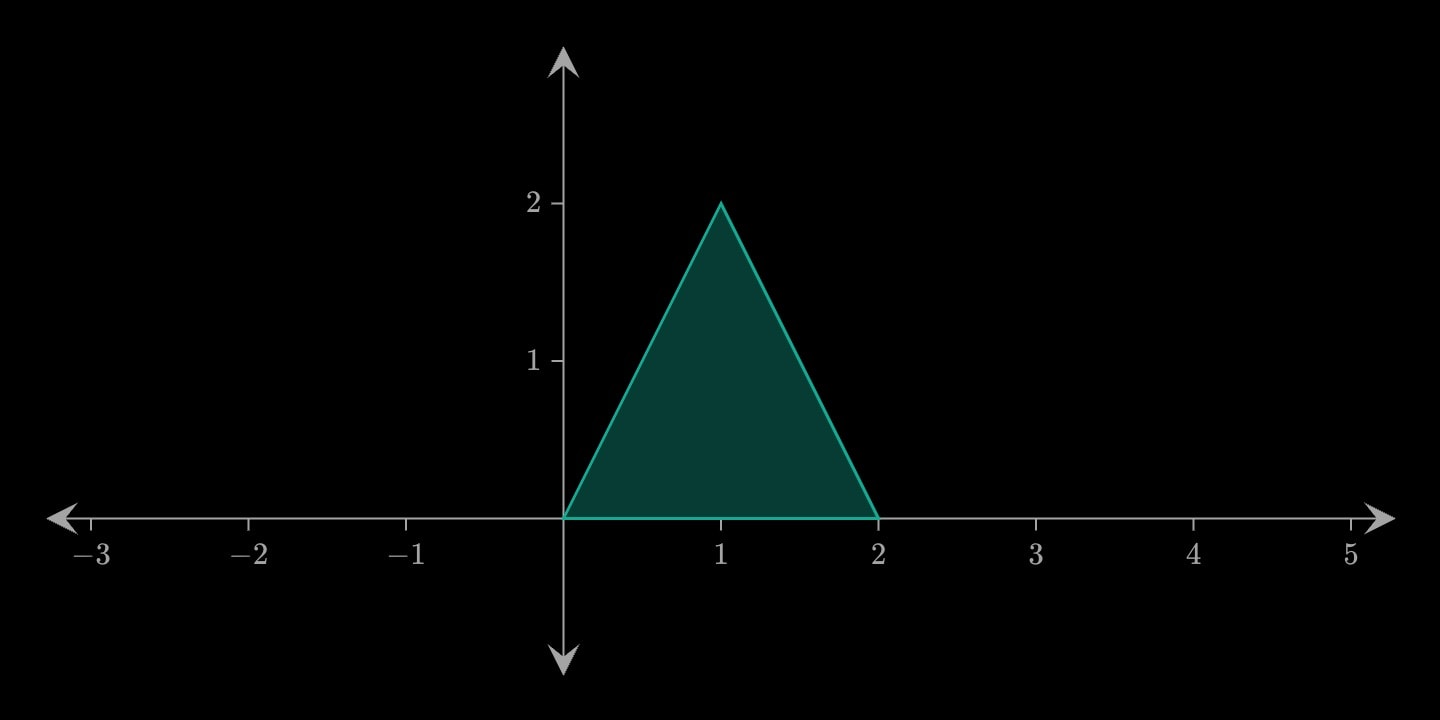
canvas.graph{
    polygon(x: 0, 2, 1; y: 0, 0, 2)
}
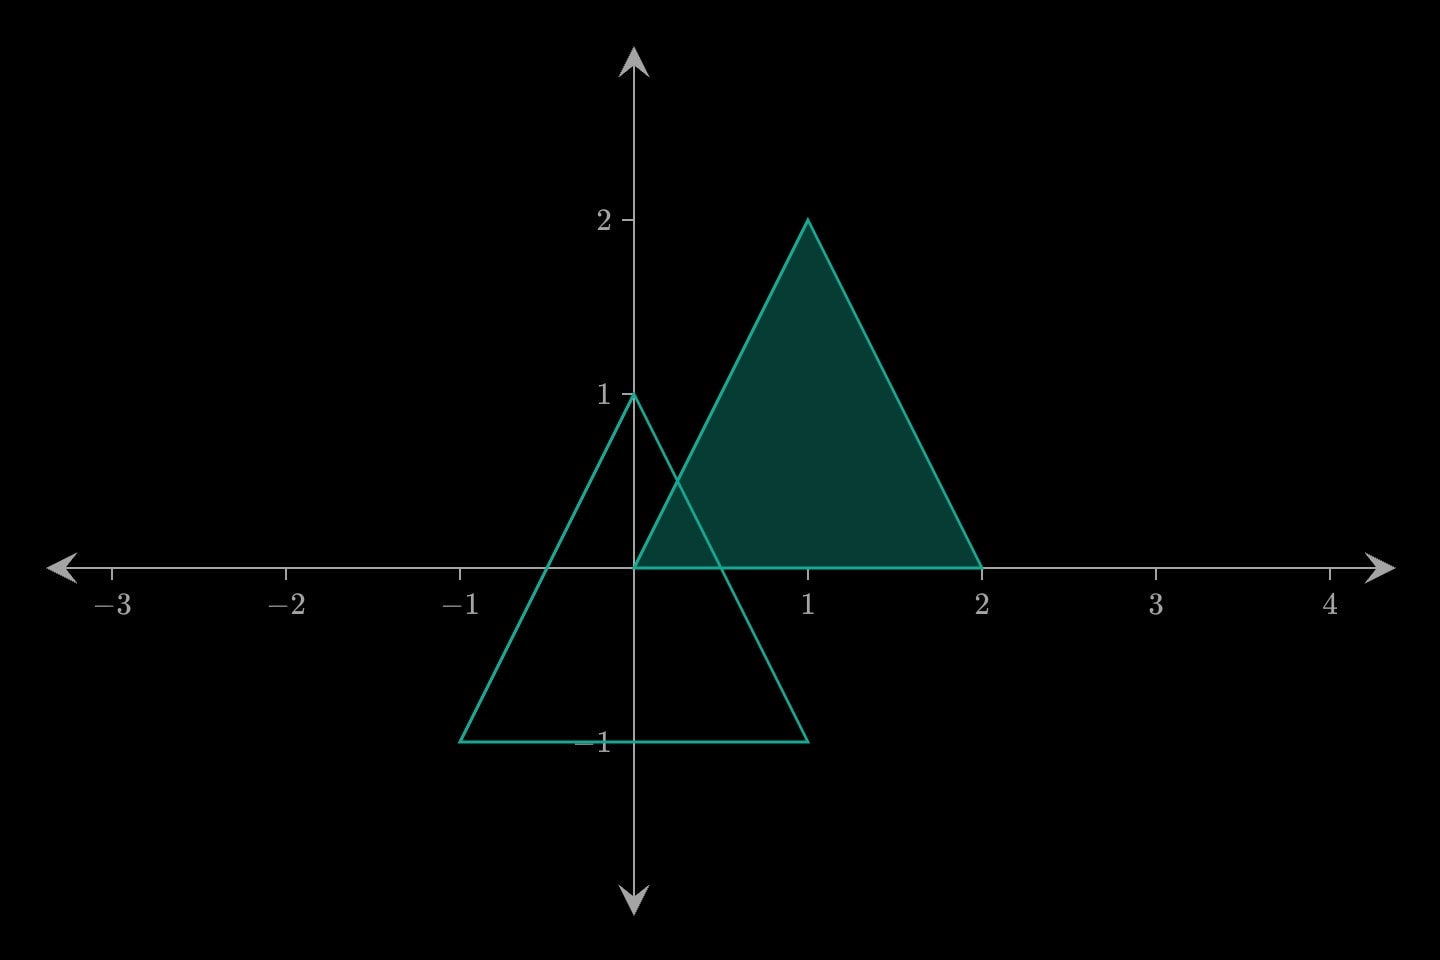
canvas.graph{
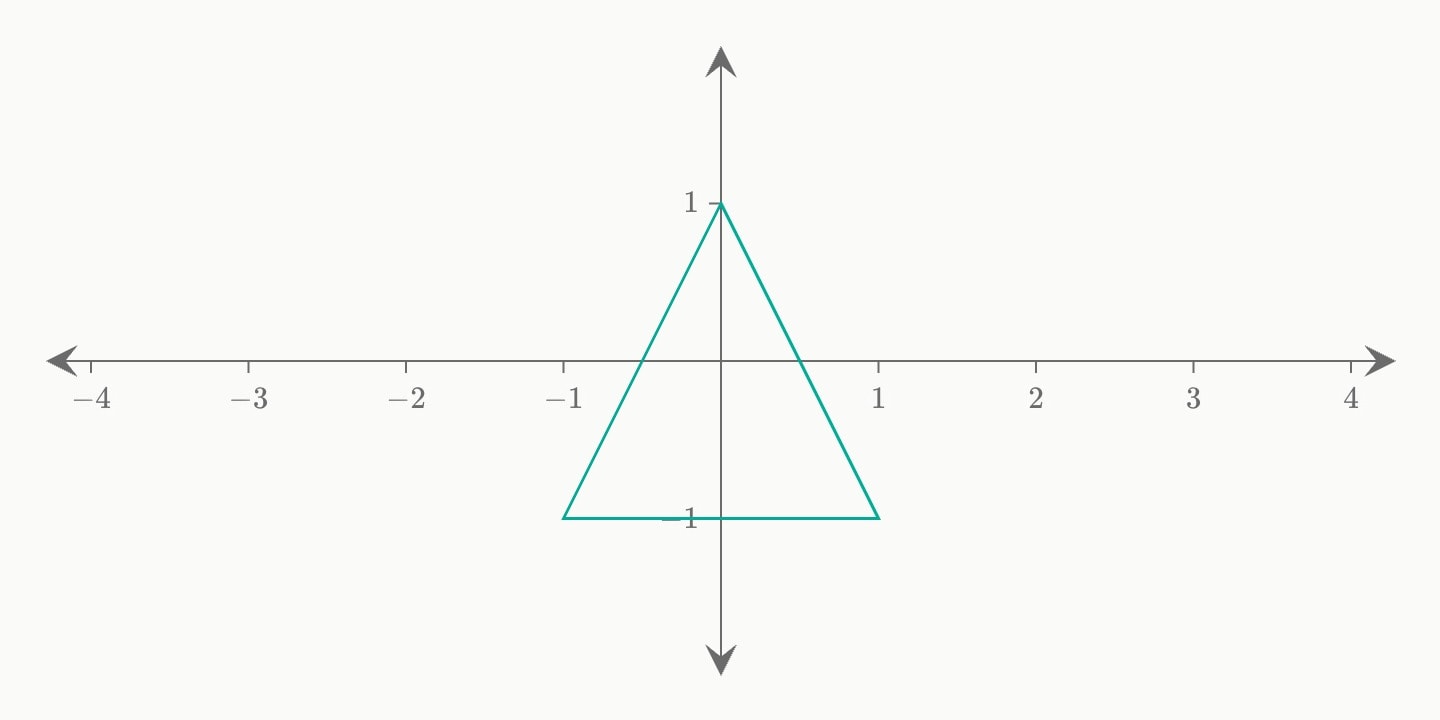
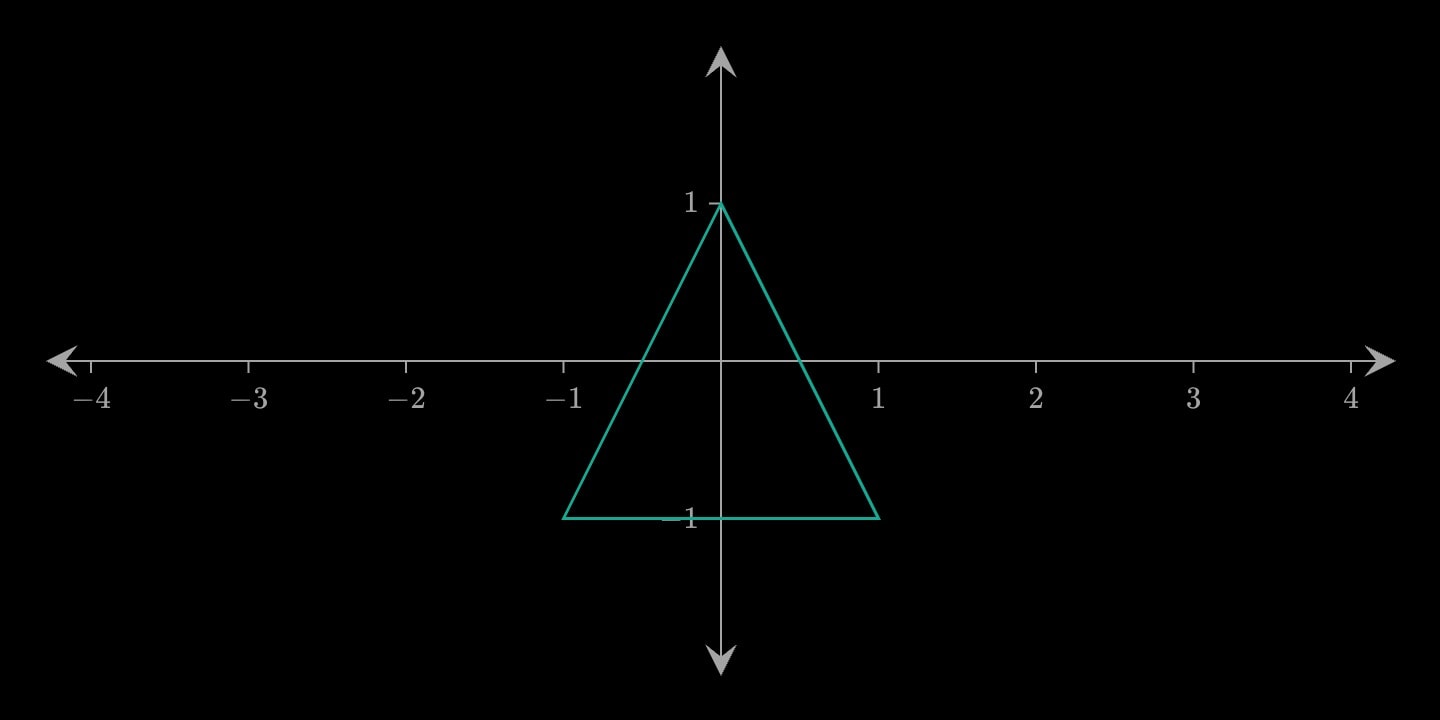
    polygon(x: -1, 1, 0; y: -1, -1, 1; fill: false; colour: teal)
}