rectangle
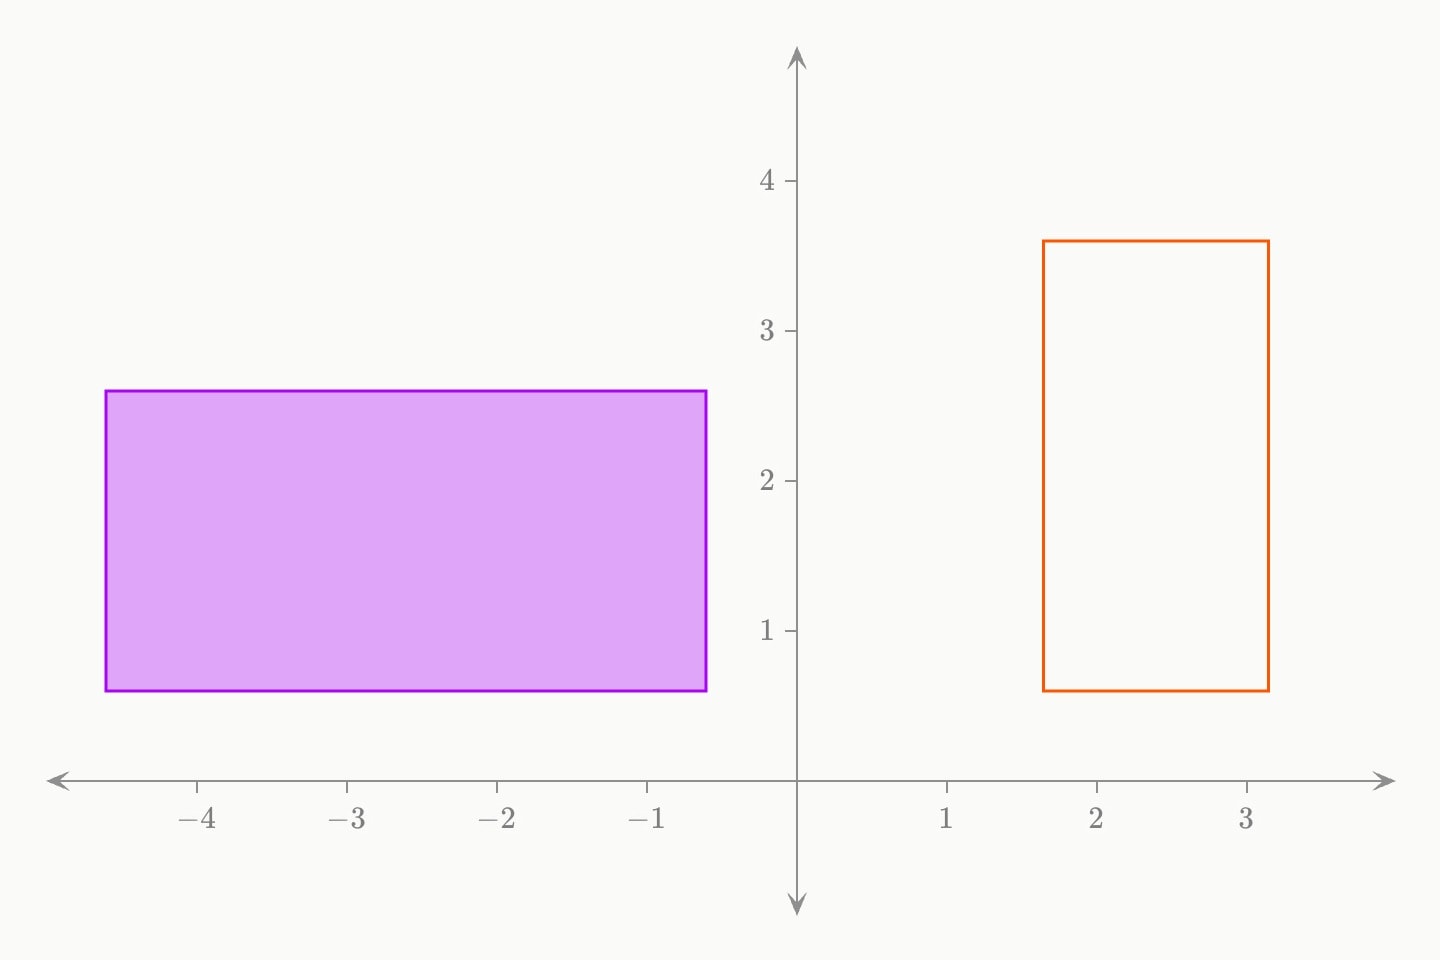
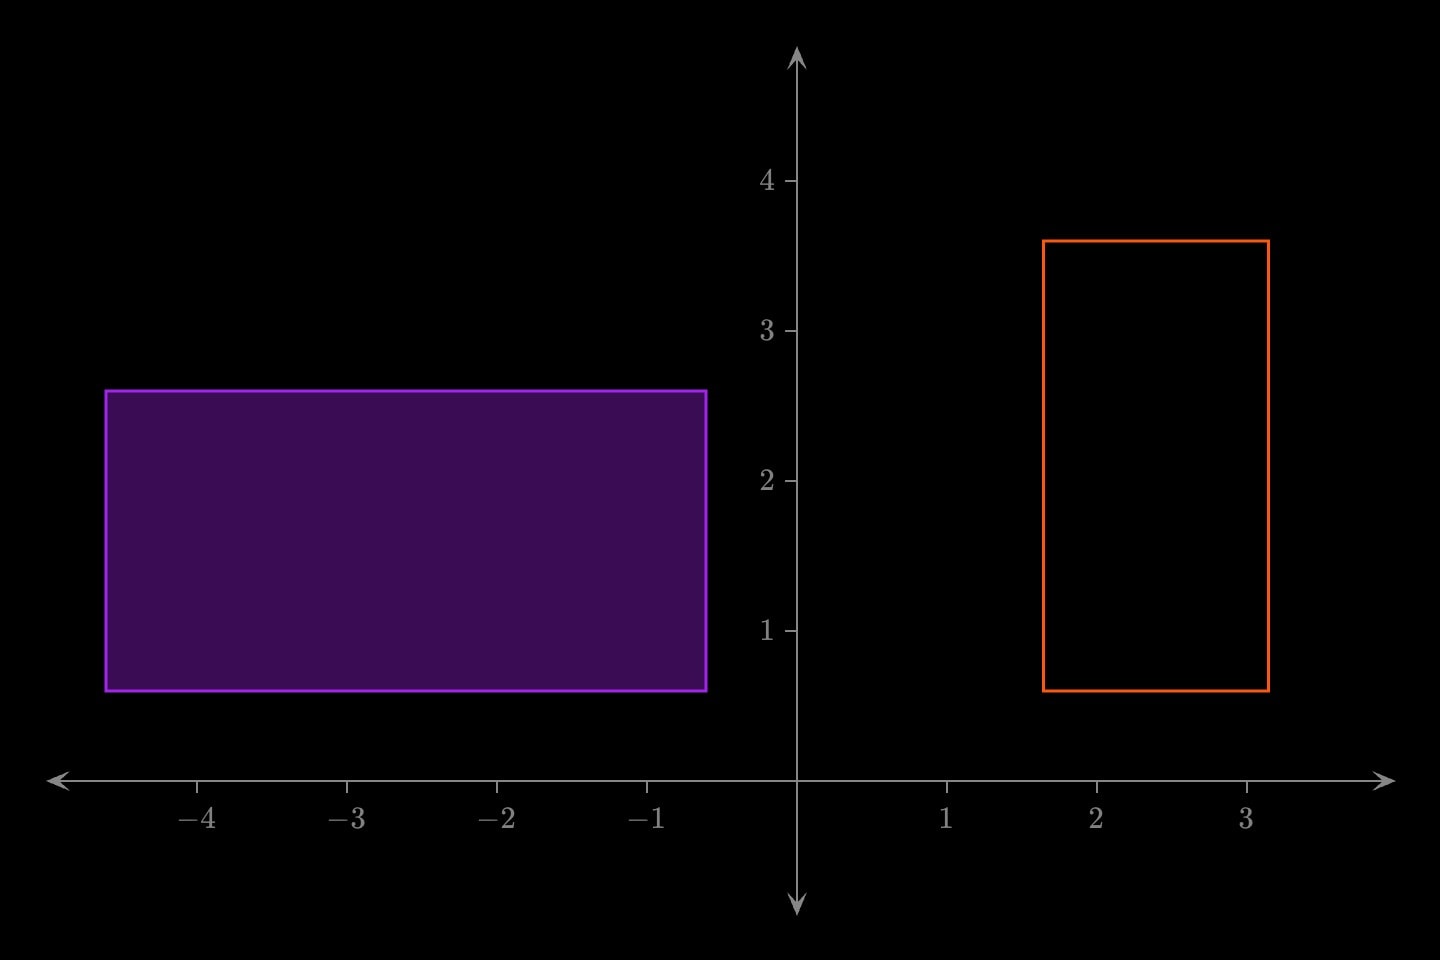
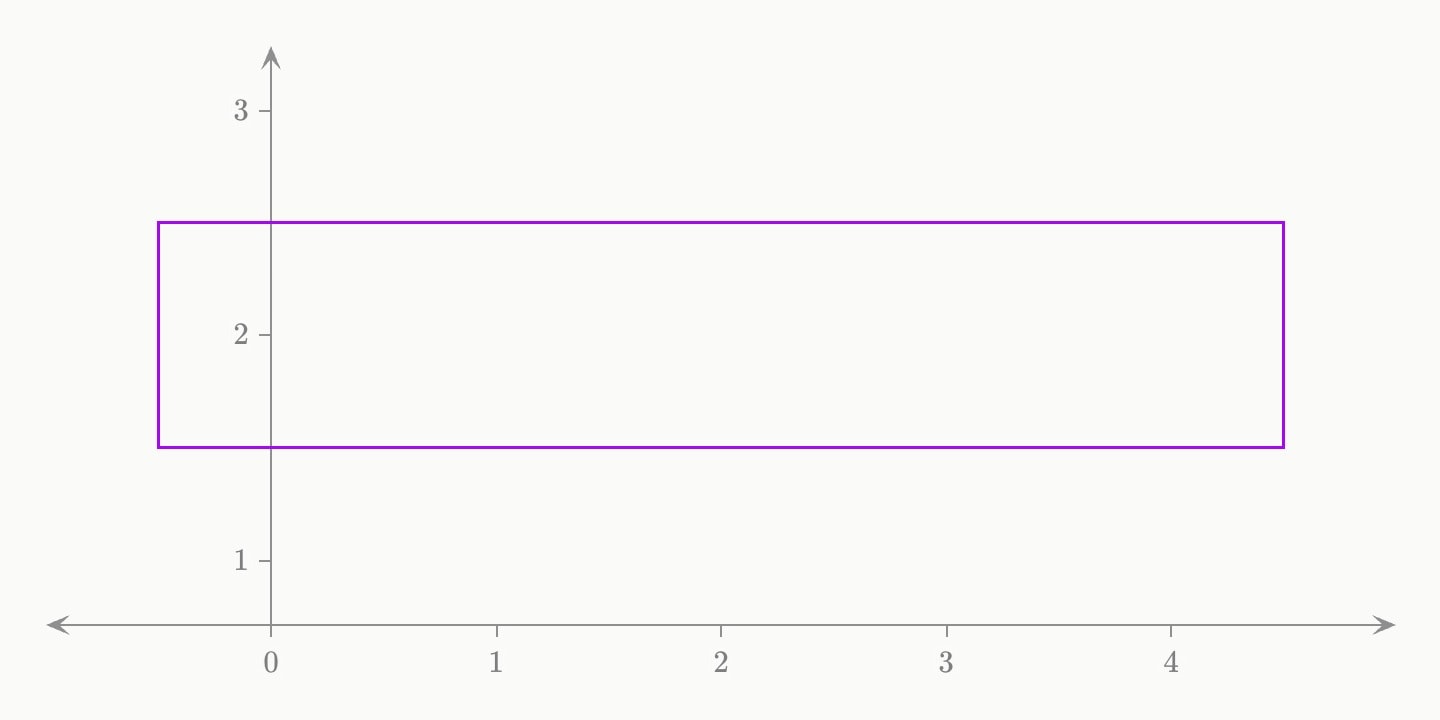
A rectangle centred at a position on a graph.
On this page
#Attributes
On any plane
colourColour.
paintAlso written:
colorDefault
purplefill-styleHow the inside is filled:
solid; hatched, ruled with diagonal lines over a pale wash of the colour; dotted, stippled with dots over the wash; or outlined, no fill, the edge alone.solidhatcheddottedoutlinedDefault
solidstroke-styleHow the edge is drawn:
solid, dashed or dotted. An outlined, dashed shape is the shape that is not there — where a figure was before it moved, a region a constraint rules out.soliddasheddottedDefault
solidopacityOpacity.
Default
1labelText drawn beside the element — rich text, so
$maths$ and inline formatting render. Fades and draws with the element.hiddenDeclared but not drawn. Animatable —
hidden: true !cue.to{false}(at: 2) reveals it — and unlike a cue, a hidden element still frames the plot, so the axes do not jump when it appears.Default
falselockKeeps the reader from editing this element on an
editable: graph. Nothing at all on a graph that is not editable.Also written:
lockedDefault
falsetext-sizeText size.
Default
20layerPaint order among the marks: a higher layer is drawn later, on top; equal or omitted, the marks stack in document order, later on top.
lengthThe width across, in data units.
Default
2heightThe height up, in data units. Left out, 0.6 of the length.
groupThe groups this mark belongs to, comma-separated:
group: Early sown, Projected. It is drawn in the colour of the first that has one and the style of the first the graph's key: gives one, unless it writes its own colour: or style, and the footer's key names every group.Only with
xyplanexX coordinate.
Can be written as shorthand:
rectangle:valueyY coordinate.
Only with
argandplanezOn the argand plane, the position as one complex number — a complex expression:
3 + 2i, (3 + 2i)^2, sqrt(13) * e^(i * a), with i the unit and parameters read as complex. Instead of re/im.reOn the argand plane, the real part of the position, a number; with
im. z: gives both at once.imOn the argand plane, the imaginary part of the position, a number; with
re. z: gives both at once.Only with
polarplanerOn the polar plane, the distance from the origin; with
theta.thetaOn the polar plane, the angle anticlockwise from the right, in radians —
60deg writes it in degrees; with r. On a categorical theta (theta format:), a name.#Derived attributes
Computed while the element renders — read one with #id.name in attribute position or {{#id.name}} in prose, never set.
areaThe shape's area in square data units, with
length: as its width and height: as its height; on the ordinary, argand and polar planes, and a dash where an axis is a log scale, names or dates, or length: does not resolve.perimeterThe length of the shape's outline in data units, with
length: as its width and height: as its height; a dash where area is.#Allowed in
#Examples
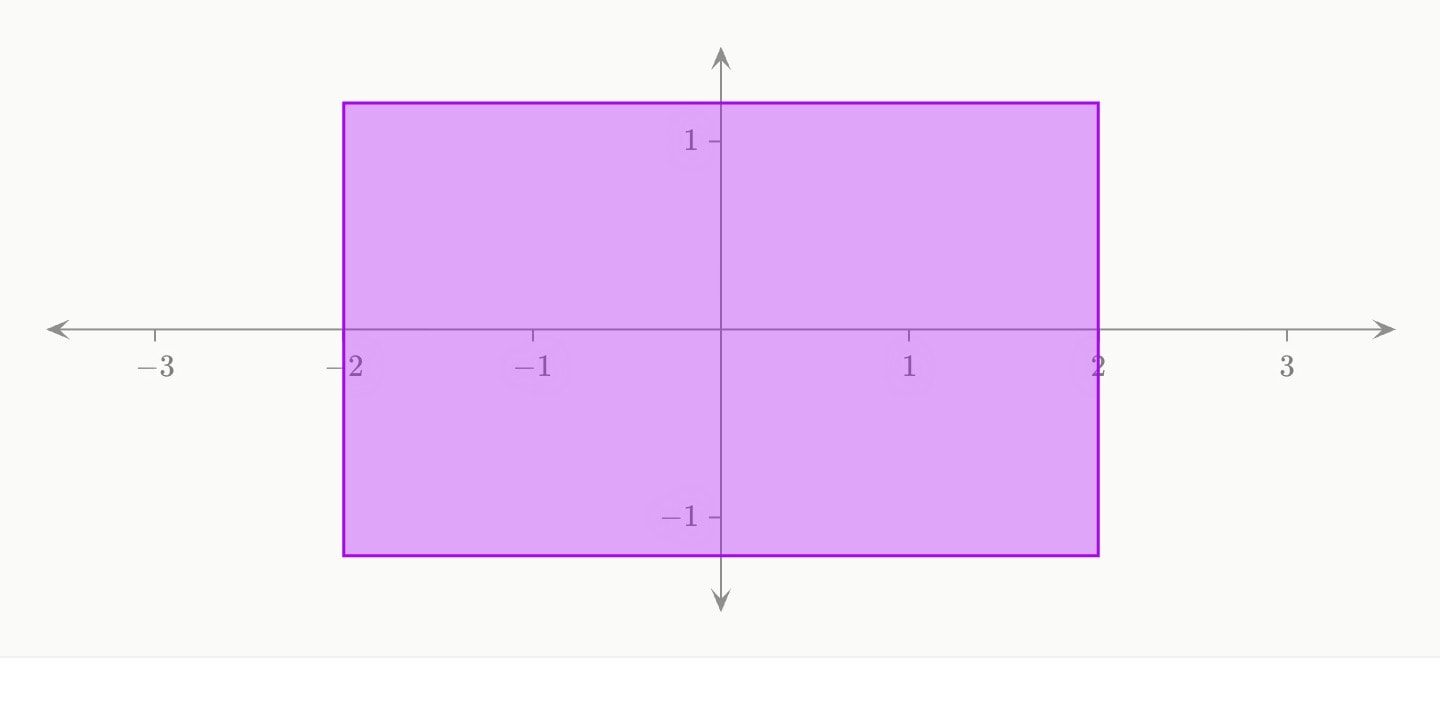
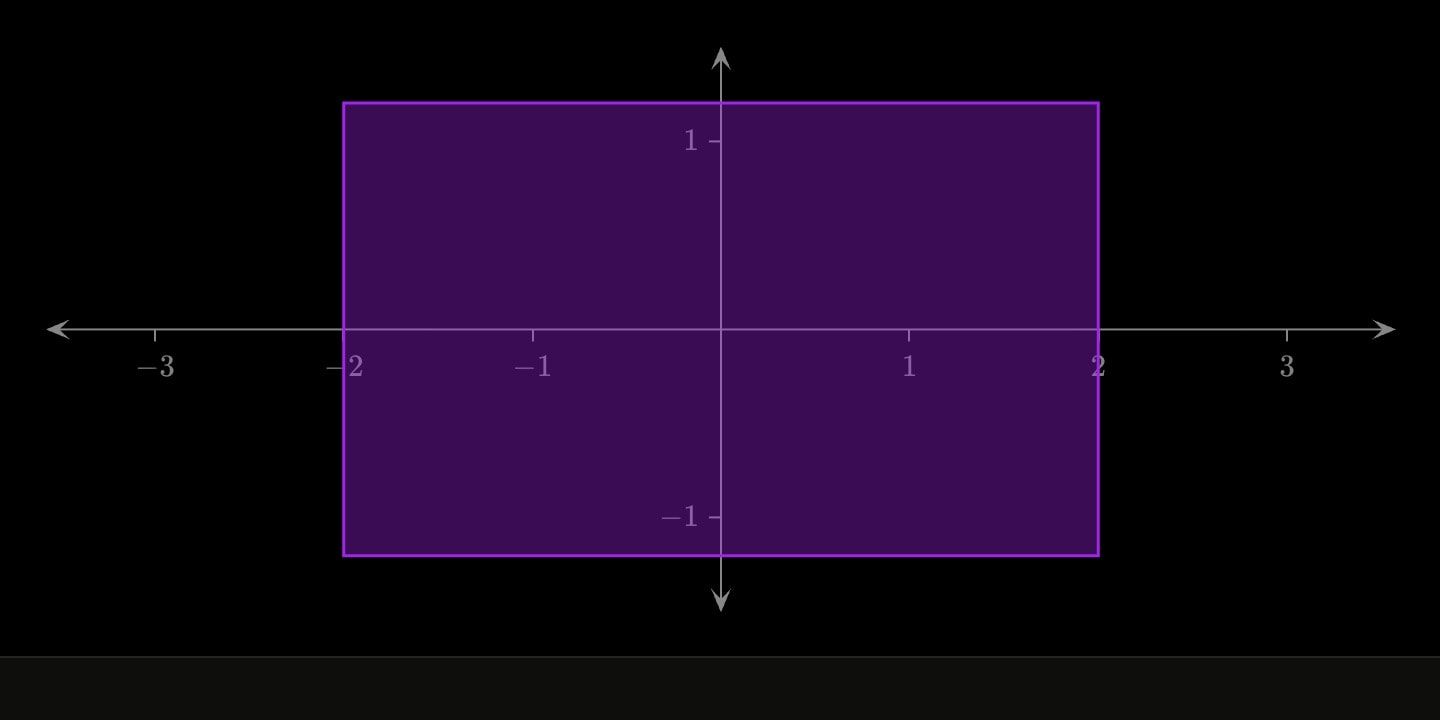
graph{
    rectangle(x: 0; y: 0; length: 4)
}
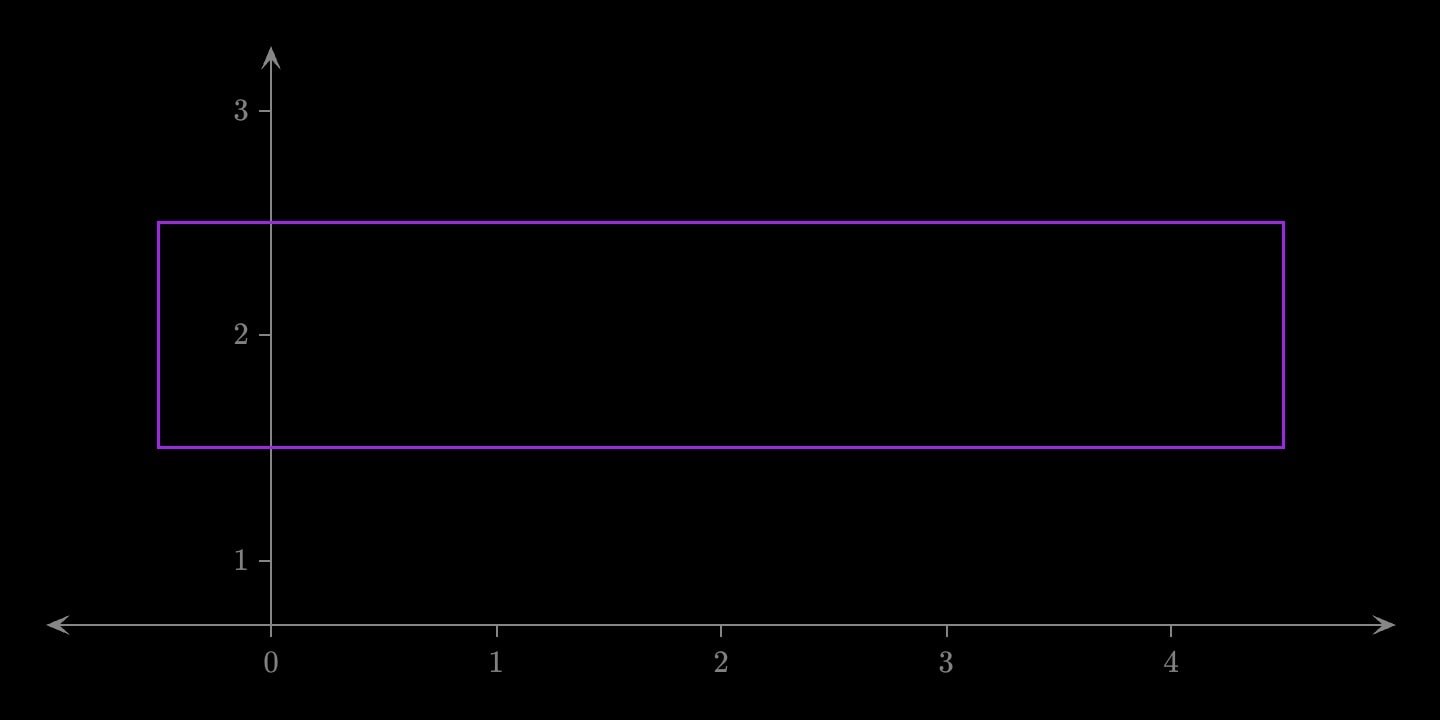
graph{
    rectangle(x: 2; y: 2; length: 5; height: 1; fill-style: outlined)
}#Notes
- One of seven shape marks —
circle,square,rectangle,triangle,star,diamond,hexagon— that differ only in the outline drawn.