Motion
The clock a scene keeps, the two kinds of cue anchored to it, and the durations and easings they take.
#The timeline
A scene has a timeline, and step markers (=== in the narrative) carve it into steps. Everything animated anchors to that clock: a step index (2), an absolute scene time (1500ms), or a step with an offset (2 + 500ms). The scene's autoplay, loop and duration attributes govern playback, below.
The clock only runs as far as the markers go: an anchor past the last marker never arrives, and a marker nothing anchors to advances a canvas that does not move. Prose and canvas state covers auditing the two against each other.
Steps are for motion the prose has to keep pace with, where the text changes between one beat and the next. Motion the reader simply watches needs no marker: anchor it to a time (at: 1s) and it plays when the reader reaches the scene. Either way the canvas toolbar holds a play control for the step being read, to pause it or play it again. A scene written !autoplay waits instead: each step with an animation stays still at its start until the reader presses play, which suits motion that has to be watched from the beginning. A step that animates nothing, or only fades something in briefly, has no control and goes ahead regardless.
loop plays each step's animation over and over until the reader pauses it, and duration sets how long each playback lasts. It is never shorter than the cues, so nothing is cut off: what a longer one adds is a hold on the finished picture before it goes round again.
Cues take two forms, distinguished by where they are written: six wrap the content they act on, two are written inside an attribute's value. Both anchor the same way and take the same easing.
#Wrapping cues
cue— fades its content in atin:and out atout:.cue.draw— draws it instead of fading, all at once overin-duration:: strokes draw along their own length and fills arrive as the stroke completes; in prose and equations, every glyph's outline is traced at once and the text fills in behind it.cue.trace— moves its content along a referenced curve, or a field's first solution:cue.trace{ point(x: 0; y: 0) }(path: #flight; at: 2).cue.highlight— pushes two rings out of the mark's edge, without changing whether it is there.cue.spotlight— dims the rest of the environment and leaves its content lit.cue.type— types its content in, in reading order, atspeed:characters a second: code character by character, prose line by line, an equation term by term.
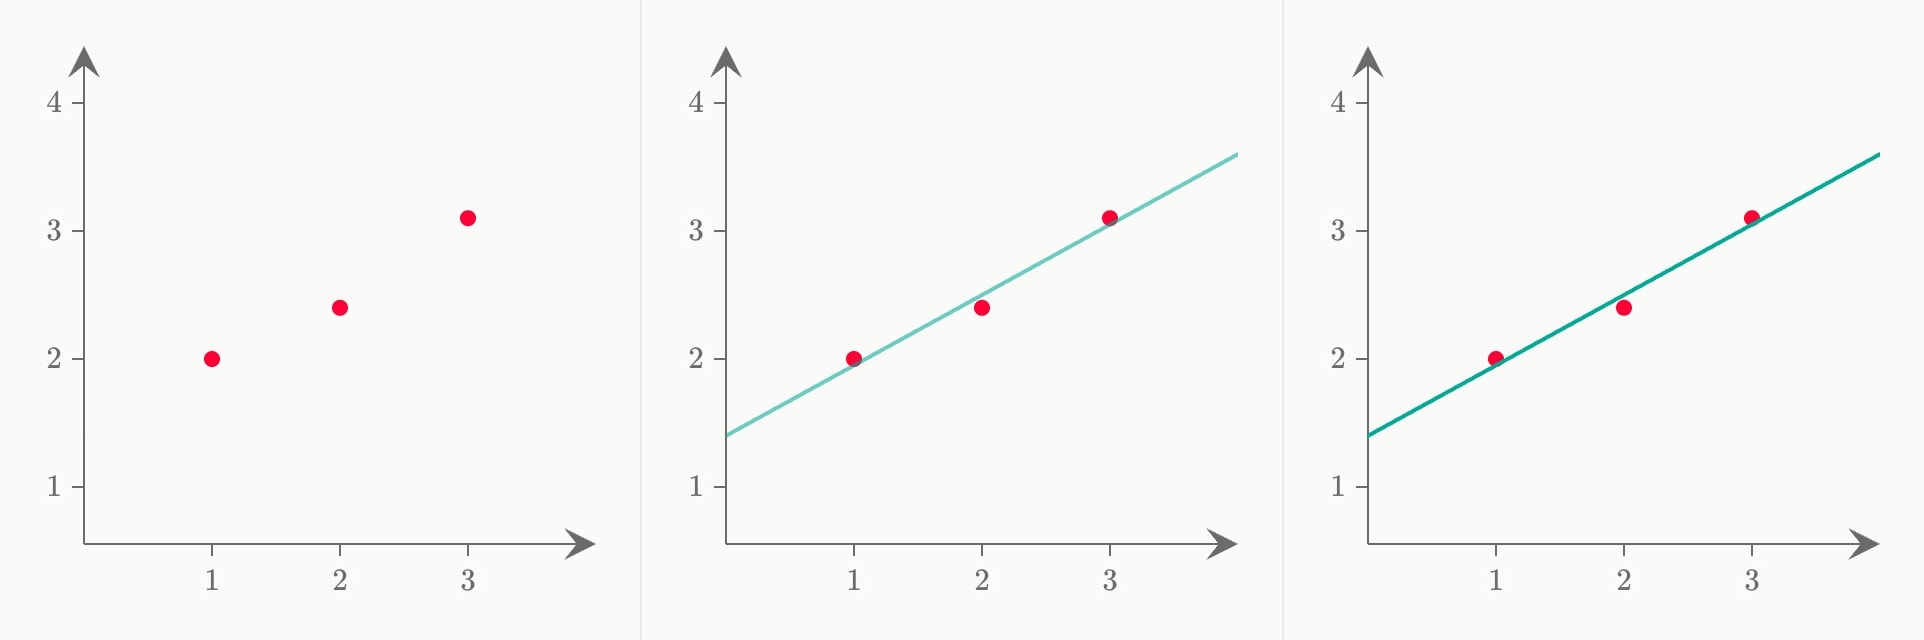
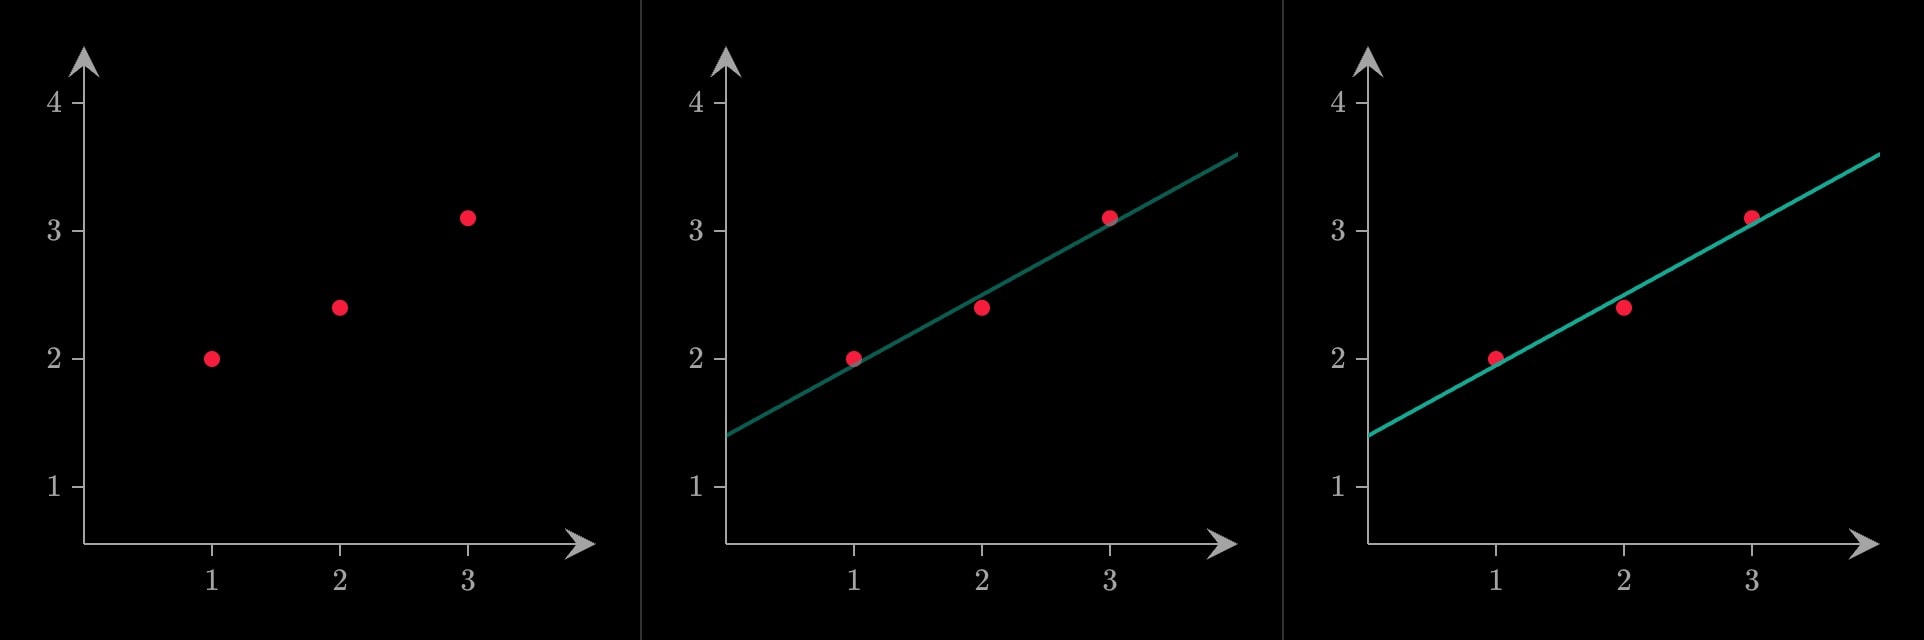
canvas.graph{
    scatter#points(x: 1, 2, 3; y: 2.0, 2.4, 3.1)
    cue{
        fit(of: #points; model: polynomial; degree: 1)
    }(
        in: 1
        in-duration: 800ms
    )
}#Keyframe cues
A cue may move a value instead of wrapping content. It is written inside the attribute's value, and what is written there is the base state.
#!cue.to
Each !cue.to names the value to move to and when.
![Three frames of the curve 100 − 4.9x² as its x-domain widens from [0, 5] to [0, 10].](/_next/image?url=%2Fmanual-figures%2Fmotion-cue-to.light.jpg&w=3840&q=90)
![Three frames of the curve 100 − 4.9x² as its x-domain widens from [0, 5] to [0, 10].](/_next/image?url=%2Fmanual-figures%2Fmotion-cue-to.dark.jpg&w=3840&q=90)
canvas.graph{
    curve(expression: 100 - 4.9x^2)
}(
    x-domain: [0, 5] !cue.to{[0, 10]}(at: 2)
)
They chain left to right on one attribute — zoom: 5 !cue.to{6.5}(at: 2) !cue.to{8}(at: 4 + 1.5s; over: 800ms) — and the animatable surface is deliberately narrow: domains, grid spacing, the show- switches, mark coordinates, hidden (a reveal that still frames the plot) and colours. Every reference page marks the attributes in it with an Animatable badge. Anything else is refused rather than ignored:
canvas.graph{
    curve(expression: x^2)
}(
    x-axis-label: time !cue.to{distance}(at: 2)
)[attribute]node `canvas.graph`: attribute `x-axis-label`: unknown micronode `cue.to`
!cue.zoom is the same move for a graph's domains, with an announcement first: a box is drawn around the smaller of the two windows and held, and only then does the view move — into the box when zooming in, out of it when zooming out. The box never moves in data coordinates. draw: and hold: time it, colour: paints it, and one chain may mix the two forms.
x-domain: [0, 10] !cue.zoom{[2, 4]}(at: 2; draw: 400ms; hold: 300ms; colour: blue)#easing, in-duration, out-duration and over
Every transition takes an easing — smooth by default, linear for constant speed — and a duration: in-duration / out-duration on cues (500ms for fades, 1500ms for draws), over: on the micronodes — 1500ms for !cue.to, and 1200ms for !cue.zoom, whose box has already said where the frame is going (its draw: defaults to 700ms and its hold: to 250ms). Durations are written in milliseconds, with ms and s suffixes accepted where a time is written; by convention a duration of a second or more is written in seconds — 1.4s, 2s — and anything shorter in milliseconds, so a scene's timings compare down a column (Source style).