text
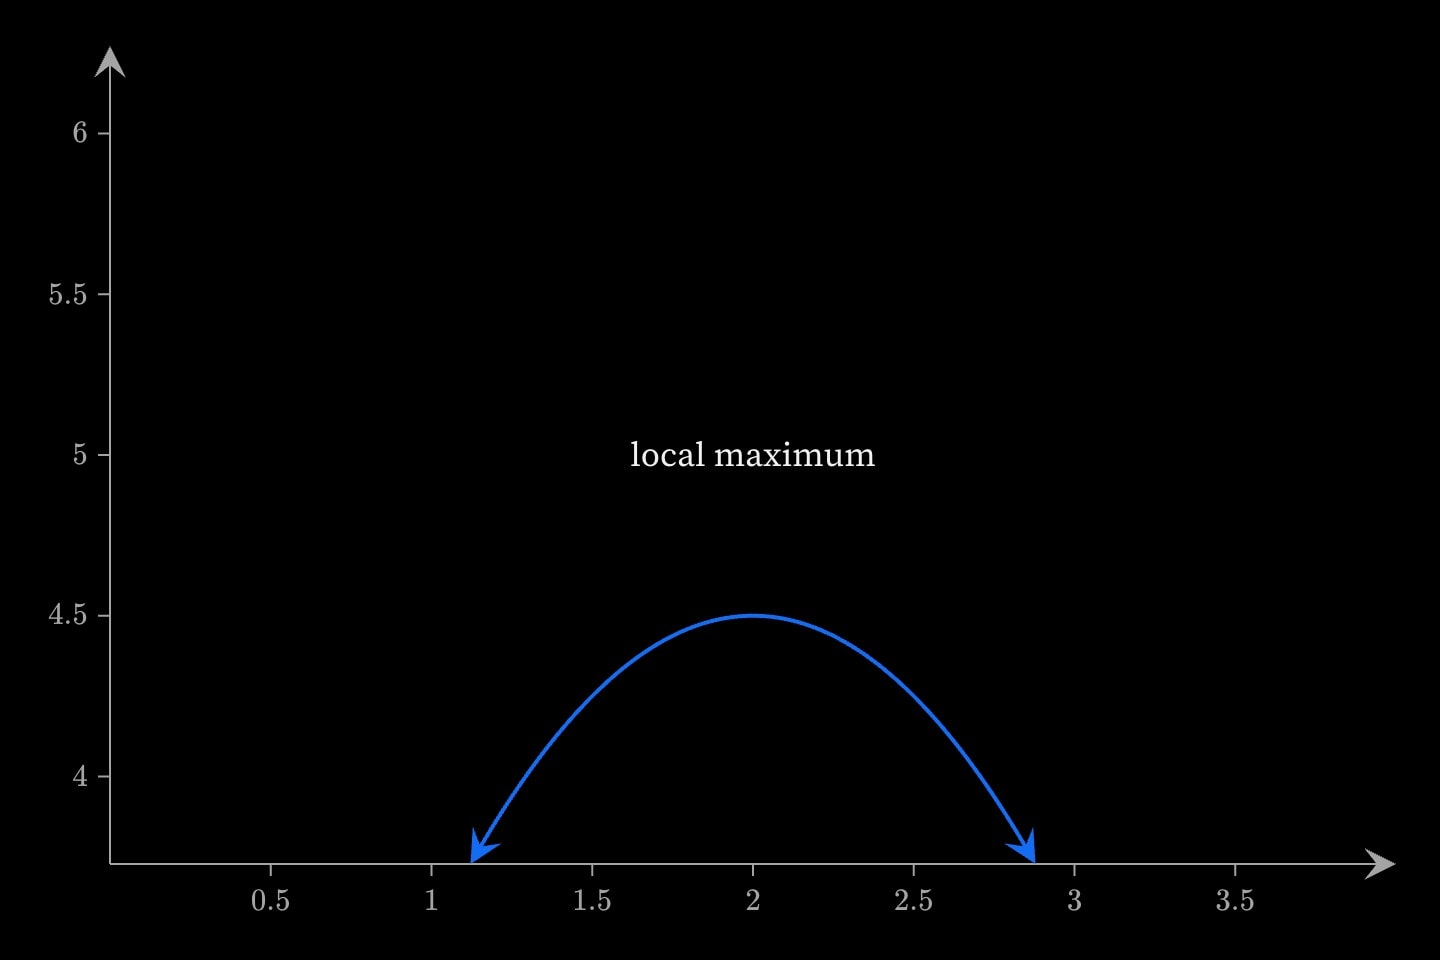
Freestanding text at (x, y) — a mark that is nothing but its label. It carries annotations belonging to the plot rather than to any one mark: a region's name, a caption inside the frame, a worked value.
text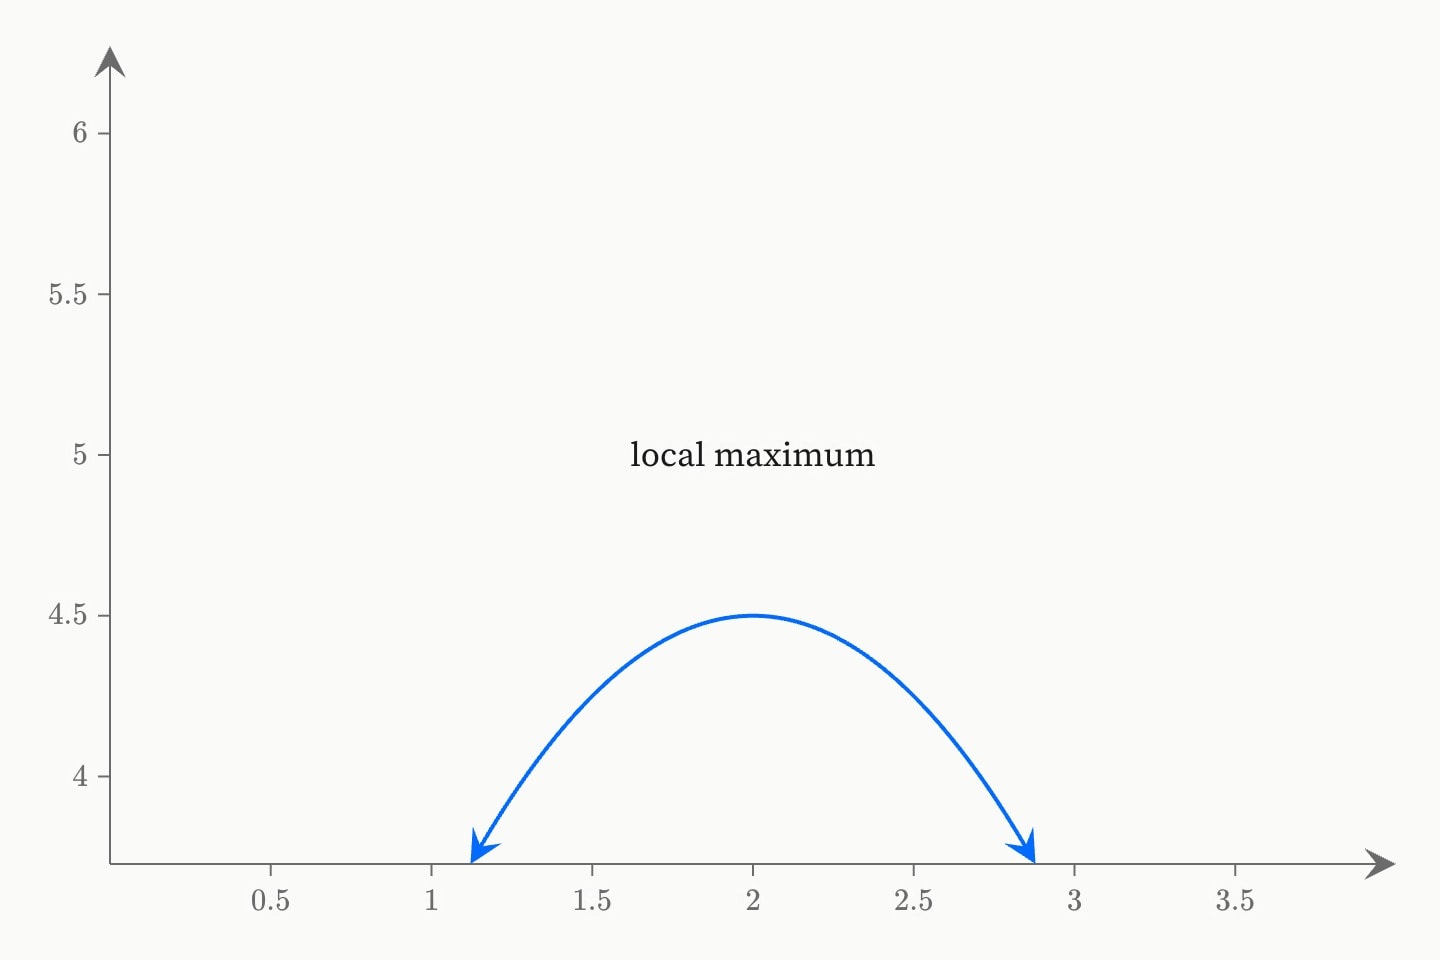
Writing with it:
#Attributes
On any plane
labelThe text itself — rich, so
$maths$ and inline formatting render.Can be written as shorthand:
text:valuesizeText size.
Default
20colourColour.
bluelight-bluedark-blueredlight-reddark-redorangelight-orangedark-orangeyellowlight-yellowdark-yellowteallight-tealdark-tealgreenlight-greendark-greenpinklight-pinkdark-pinkpurplelight-purpledark-purplegreylight-greydark-greyneutralhex(…)rgb(…)colorDefault
neutralanchorHow the text sits on its point:
middle centres it, start and end put its left or right edge there.Default
middlehiddenDeclared but not drawn. Animatable —
hidden: true !cue.to{false}(at: 2) reveals it — and a hidden element still frames the plot, so the axes do not jump when it appears.Default
falselockKeeps the reader from editing this element on an
editable: graph.Also written:
lockedDefault
falselayerPaint order among the marks: a higher layer is drawn later, on top; equal or omitted, the marks stack in document order (later on top). Written
z: before the argand plane took that letter for its coordinate.Only with
xplanexX coordinate of the anchor.
Only with
xyplanexX coordinate of the anchor.
yY coordinate of the anchor.
Only with
argandplanezOn the argand plane, the position as one complex number — a complex expression:
3 + 2i, (3 + 2i)^2, sqrt(13) * e^(i * a), with i the unit and parameters read as complex. Instead of re/im.reOn the argand plane, the real part of the position, a number; with
im. z: gives both at once.imOn the argand plane, the imaginary part of the position, a number; with
re. z: gives both at once.Only with
polarplanerOn the polar plane, the distance from the origin; with
theta.thetaOn the polar plane, the angle anticlockwise from the right, in radians —
60deg writes it in degrees; with r. On a categorical theta (theta format:), a name.#Allowed in
#Examples
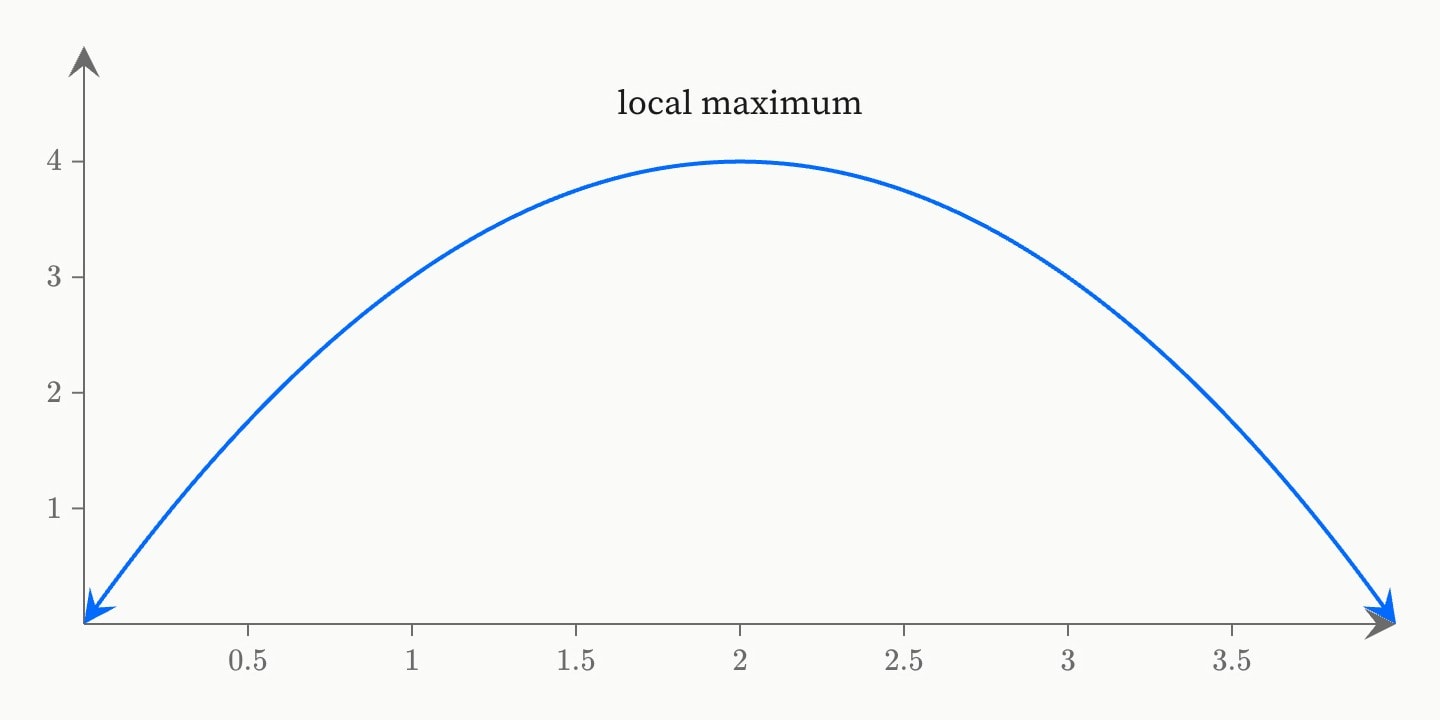
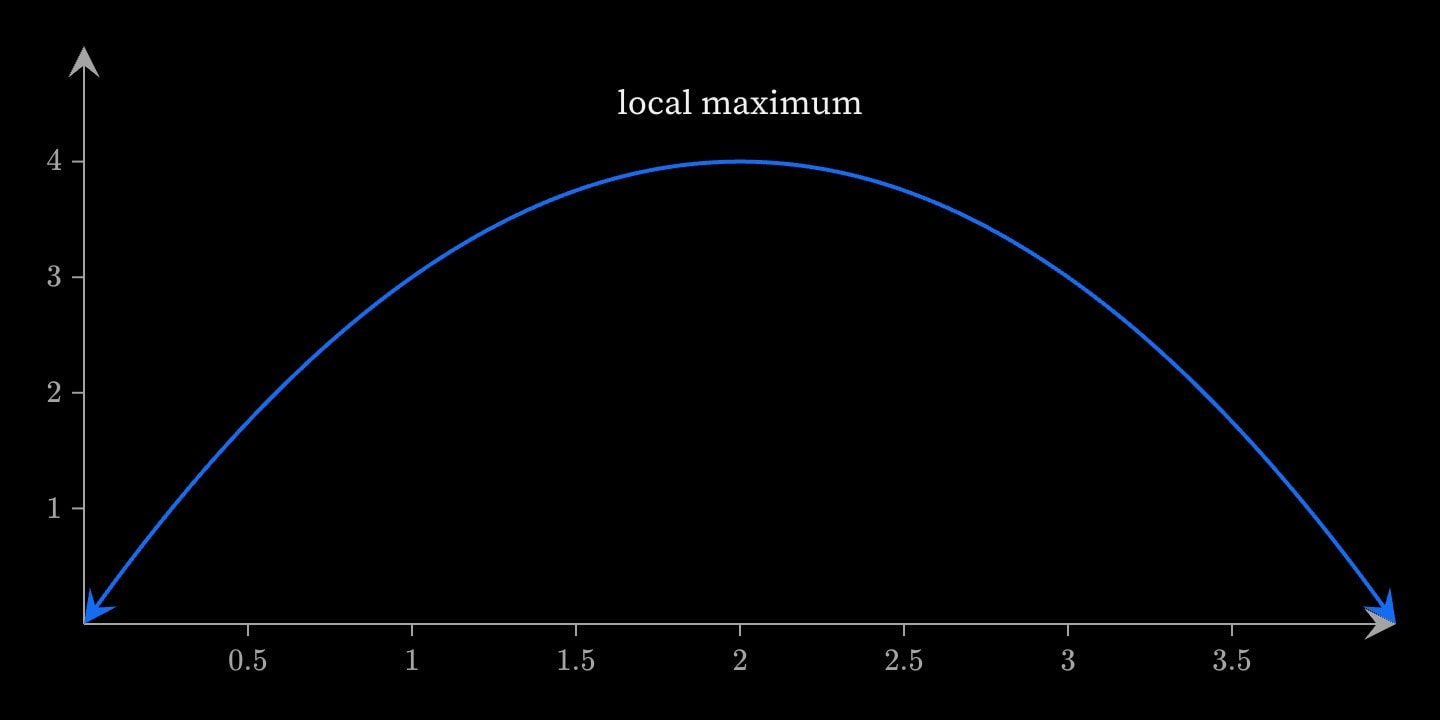
canvas.graph{
    curve(expression: 4 - (x - 2)^2)
    text(label: local maximum; x: 2; y: 4.5)
}(
    x-domain: [0, 4]
    y-domain: [0, 5]
)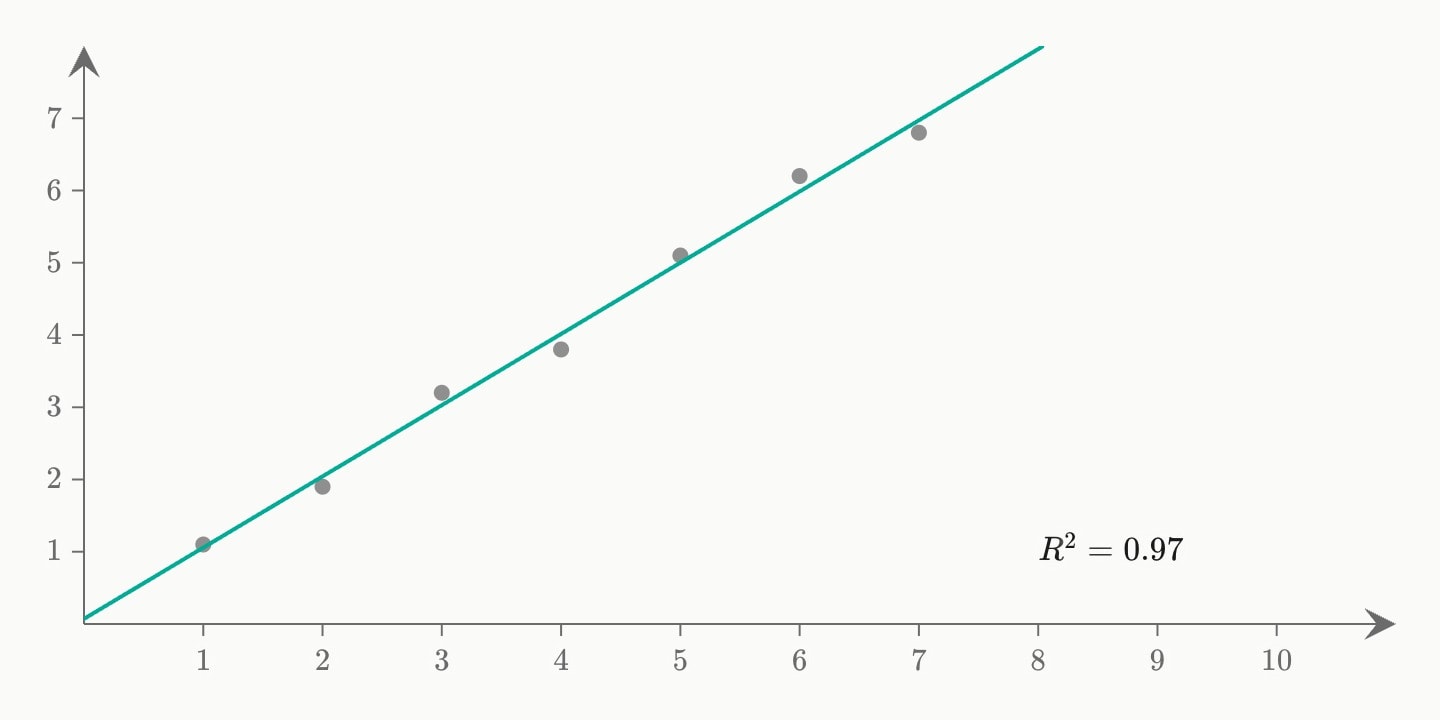
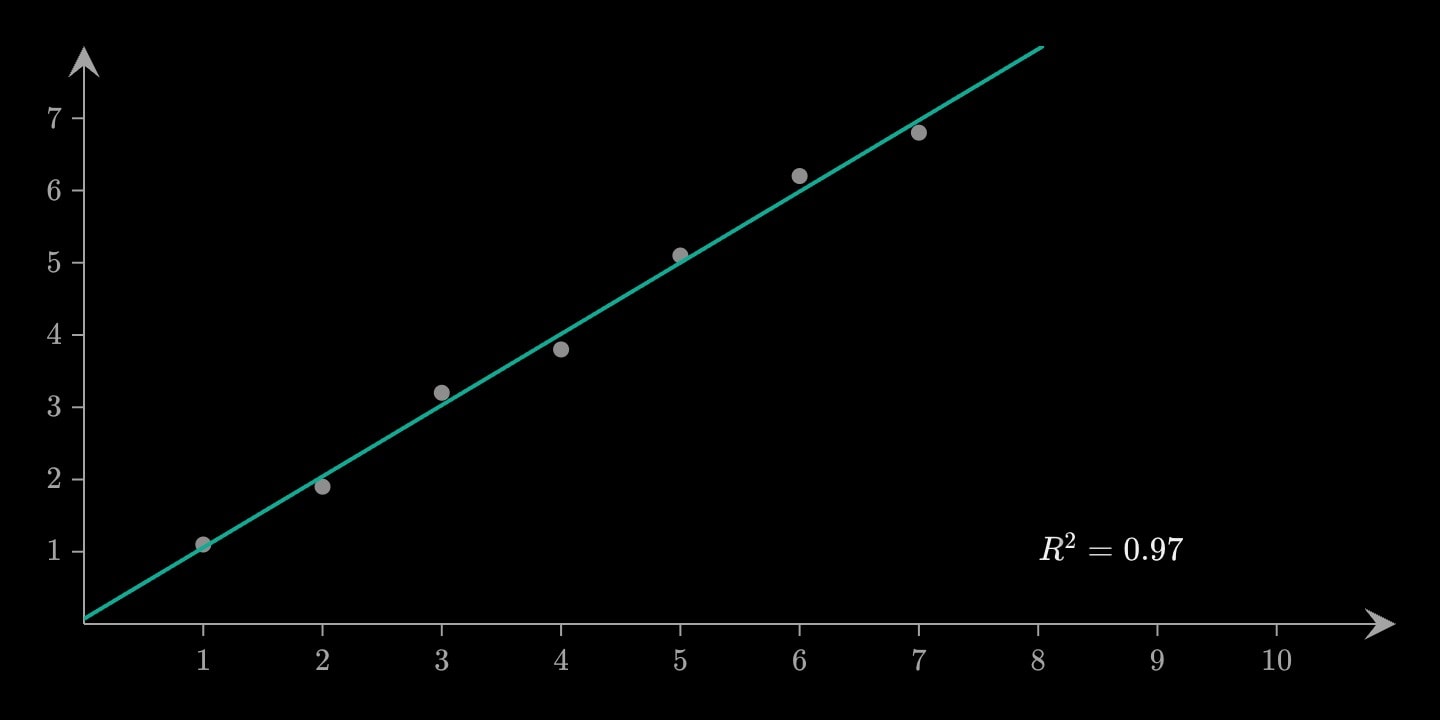
canvas.graph{
    scatter#readings(x: 1, 2, 3, 4, 5, 6, 7; y: 1.1, 1.9, 3.2, 3.8, 5.1, 6.2, 6.8; colour: grey)
    fit(of: #readings; degree: 1)
    text(label: $R^2 = 0.97$; x: 8; y: 1; anchor: start)
}(
    x-domain: [0, 11]
)