choropleth
A dataset column joined onto a map's regions and shaded by value.
choropleth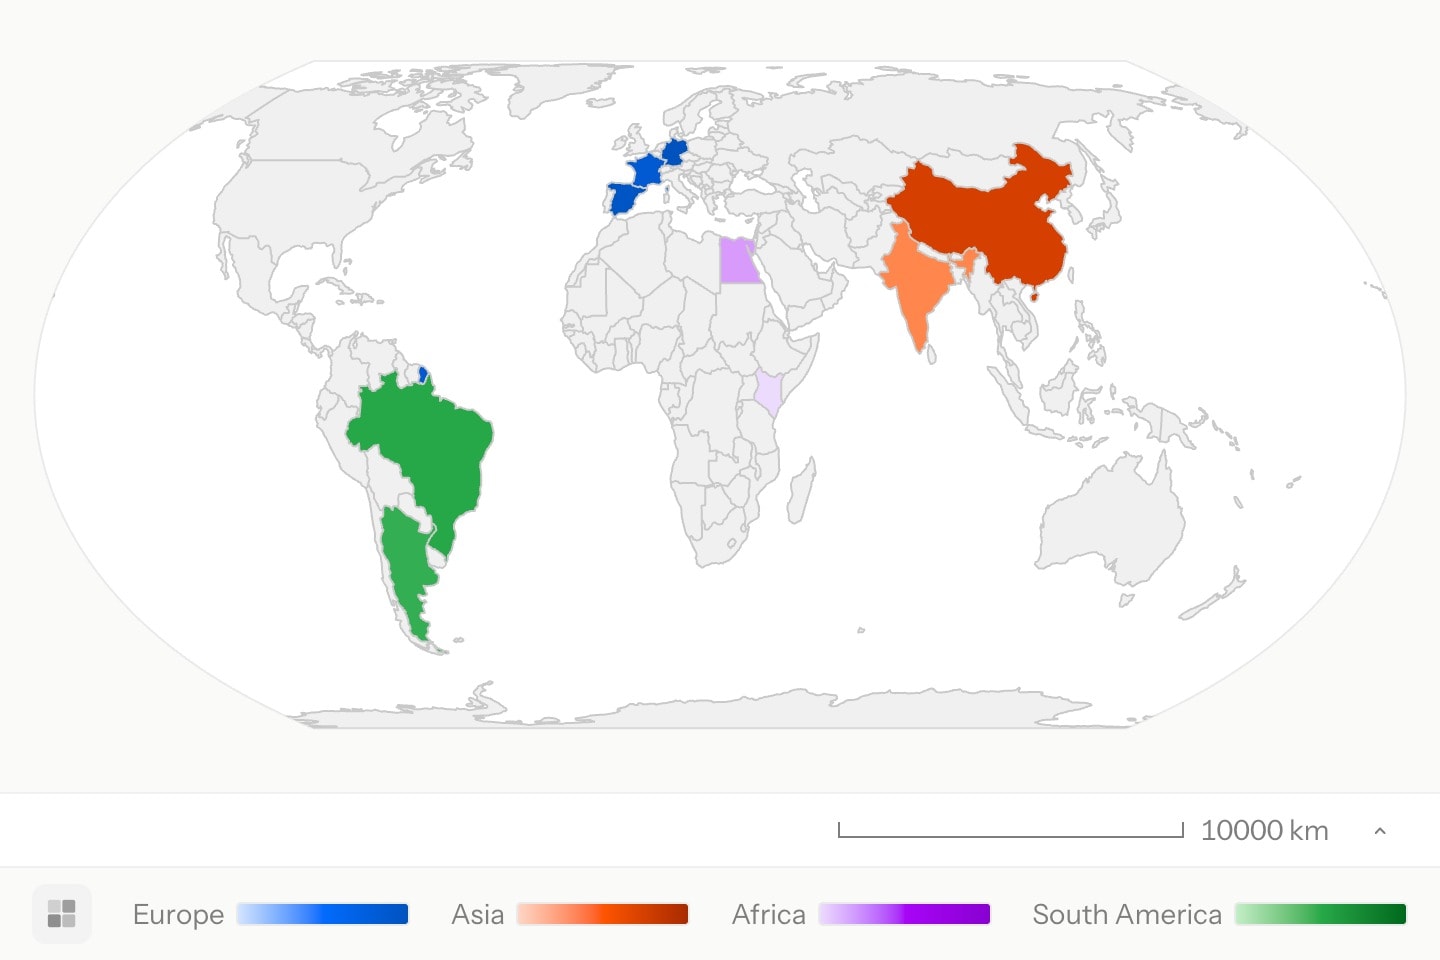
#Attributes
basemapThe boundary pack the join shades. Defaults to the environment's own
basemap:. It may instead be #id naming an attached .geojson dataset — in: #wards — which makes the attachment itself the boundaries.worldus-statescanada-provincesaustralia-statesuk-countiesnz-regionseurope-admin1choropleth:valueregionsThe
regions: #gdp.country. Matching ignores case and accents; on world the codes are ISO alpha-3.valuesThe column to shade by, a column of numbers:
values: #gdp.gdppc. Animatable, which is how a map moves through columns: values: #y1990.rate !cue.to{#y2000.rate}(at: 1) eases every region between its own two readings. Pin range: when animating, or the scale is re-fitted each frame and the change hides itself. Every reference is checked at compile time, the base and each keyframe alike.colourThe scale every region shades along, unless
colours: hands it one of its own. multicolour, the default, runs the full spectrum, violet low to red high; temperature is the blue → white → red ramp for diverging data — pair it with a symmetric range: to pin white at zero; any ordinary hue shades its own intensity ramp instead. Both ramps are fixed colours, identical in light and dark mode.blueredorangeyellowtealgreenpinkpurplegreyhex(…)rgb(…)multicolourtemperaturecolorDefault
multicolourrangeThe value window the ramp spans,
range: [0, 60]; values outside it clamp. Absent, the ramp spans the joined extrema. Animatable — a !cue.to re-normalises the shading across steps.invertFlip the ramp, putting deep colour at low values rather than high.
Default
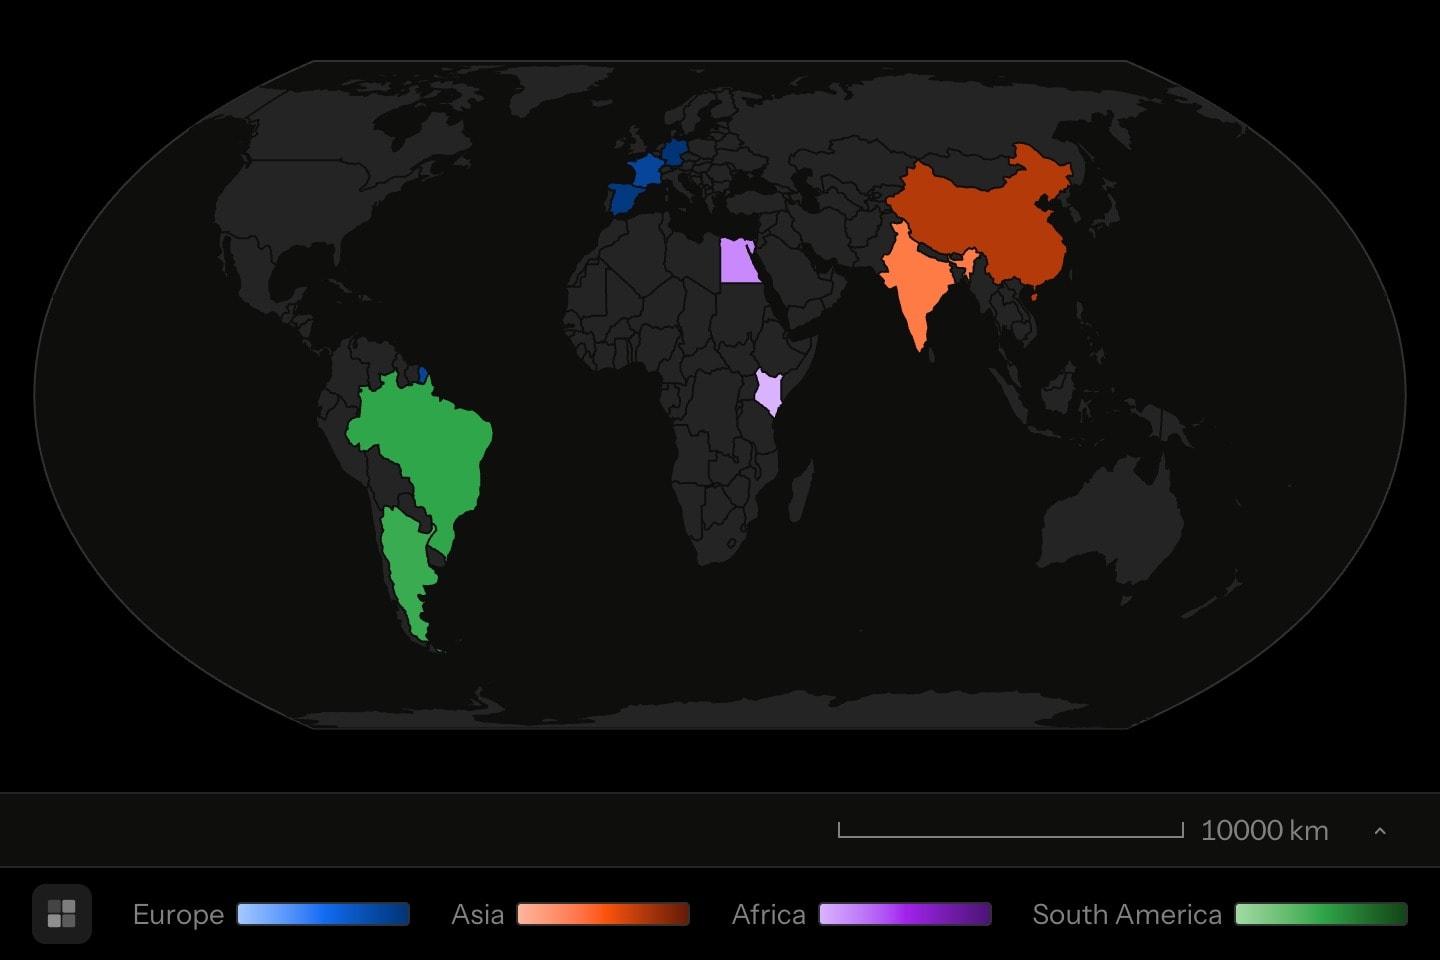
falsecoloursA scale per row, as a column: each cell holds whatever
colour: would — how an electoral map gives each party its own. Absent, every region shades along colour:; present, each shades along its own, placed by where its value sits between the least and greatest on the whole map. Rows sharing a cell are one group in the legend, named by labels:; a row whose cell is empty falls back to colour:.Also written:
colorslabelsWhat to CALL each scale in the legend — a column read beside
colours:, one name per row, the first row of a group naming it. Without it a group is named by the colour it is drawn in, which says what the reader can already see and not what it means.sliceThe column this mark is sliced by — long-format data, one row per region per slice — showing the slice the scene's control over that column stands on. A numeric column eases each region between the readings either side of the control; a column of names shows the rows carrying the name picked. With no control over the column, each region shows its first row.
opacityHow heavy the shading sits over the basemap,
0 to 1.Default
1hiddenDeclared but not drawn. Animatable, so
hidden: true !cue.to{false}(at: 2) is the overlay's reveal.Default
false#Derived attributes
Computed while the element renders — read one with #id.name in attribute position or {{#id.name}} in prose, never set.
minThe smallest joined value. Cite it in prose with
{{#id.min}}.maxThe largest joined value.
meanThe mean of the joined values.
countHow many regions the join actually covered — worth citing when it is fewer than the dataset has rows.
#Allowed in
#Examples
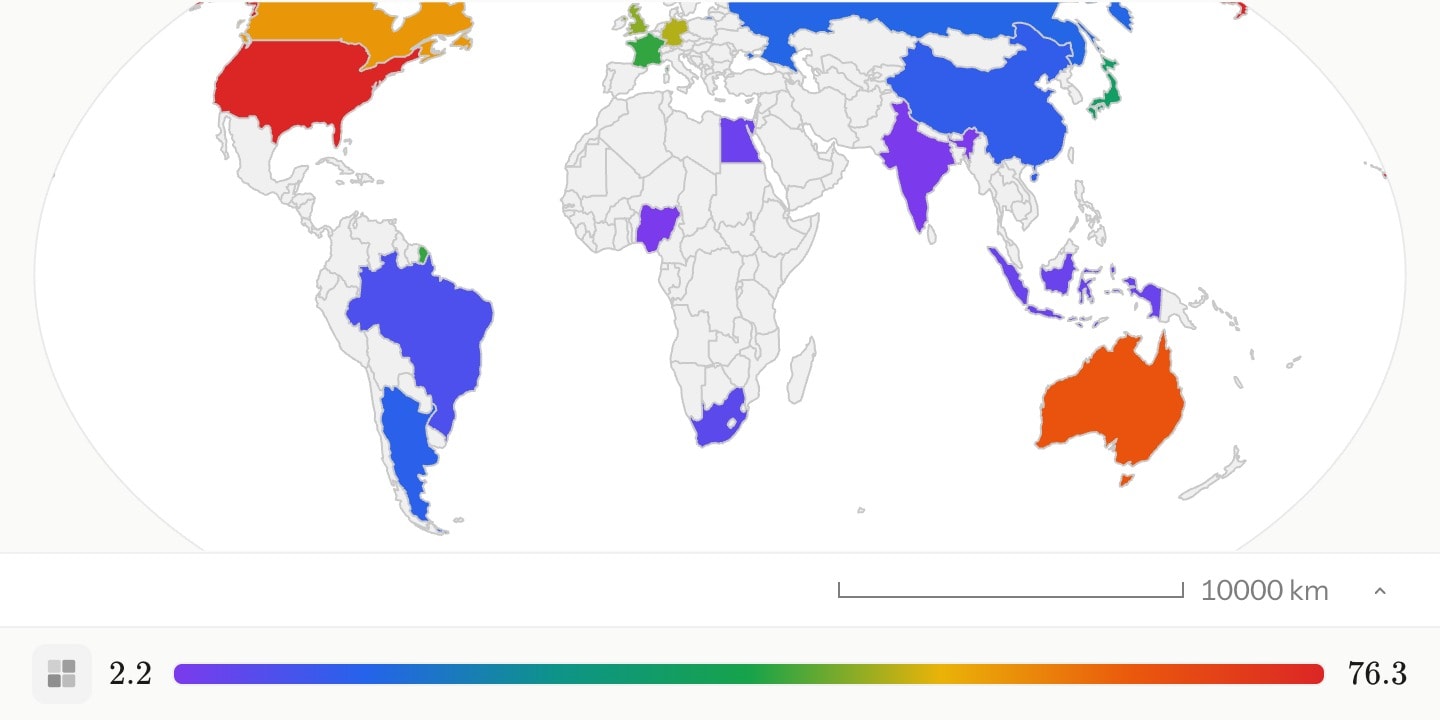
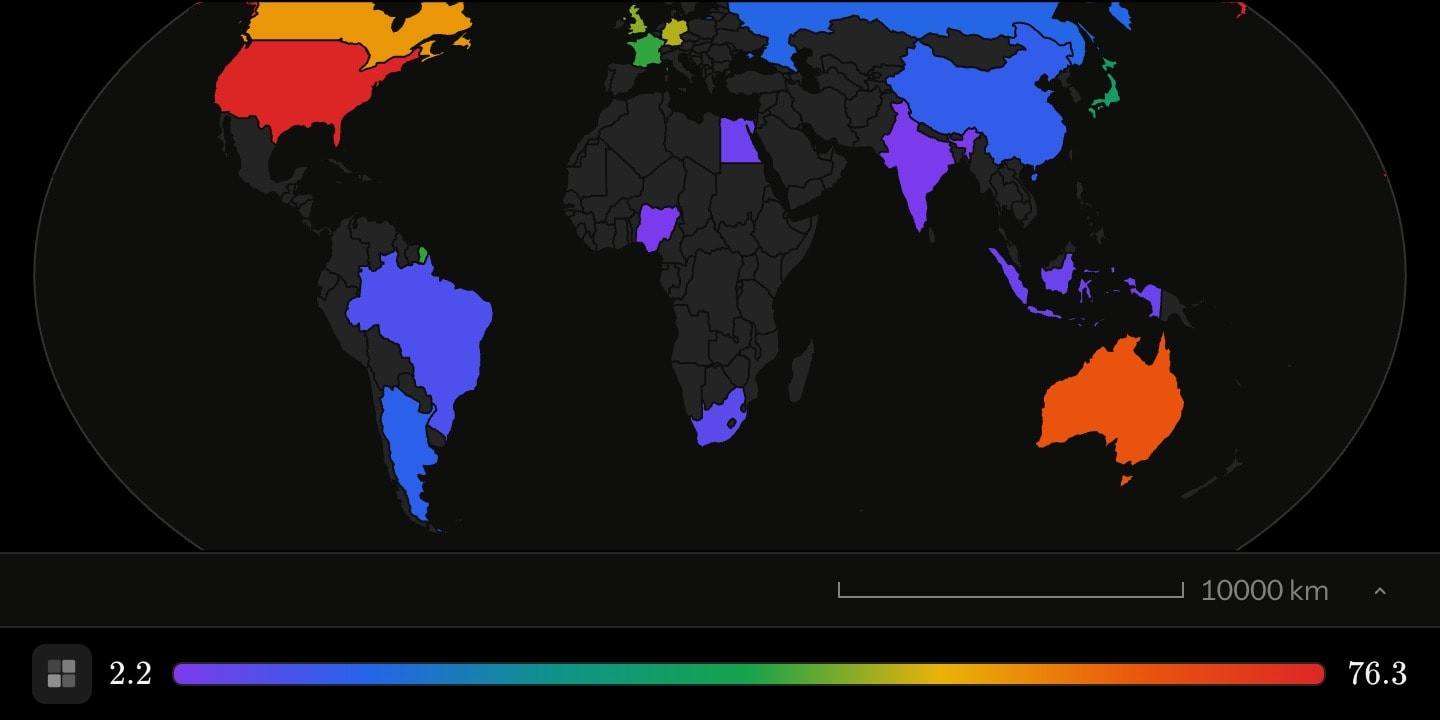
region:world{
    choropleth#gdp(basemap: world; regions: #economy.country; values: #economy.gdppc)
}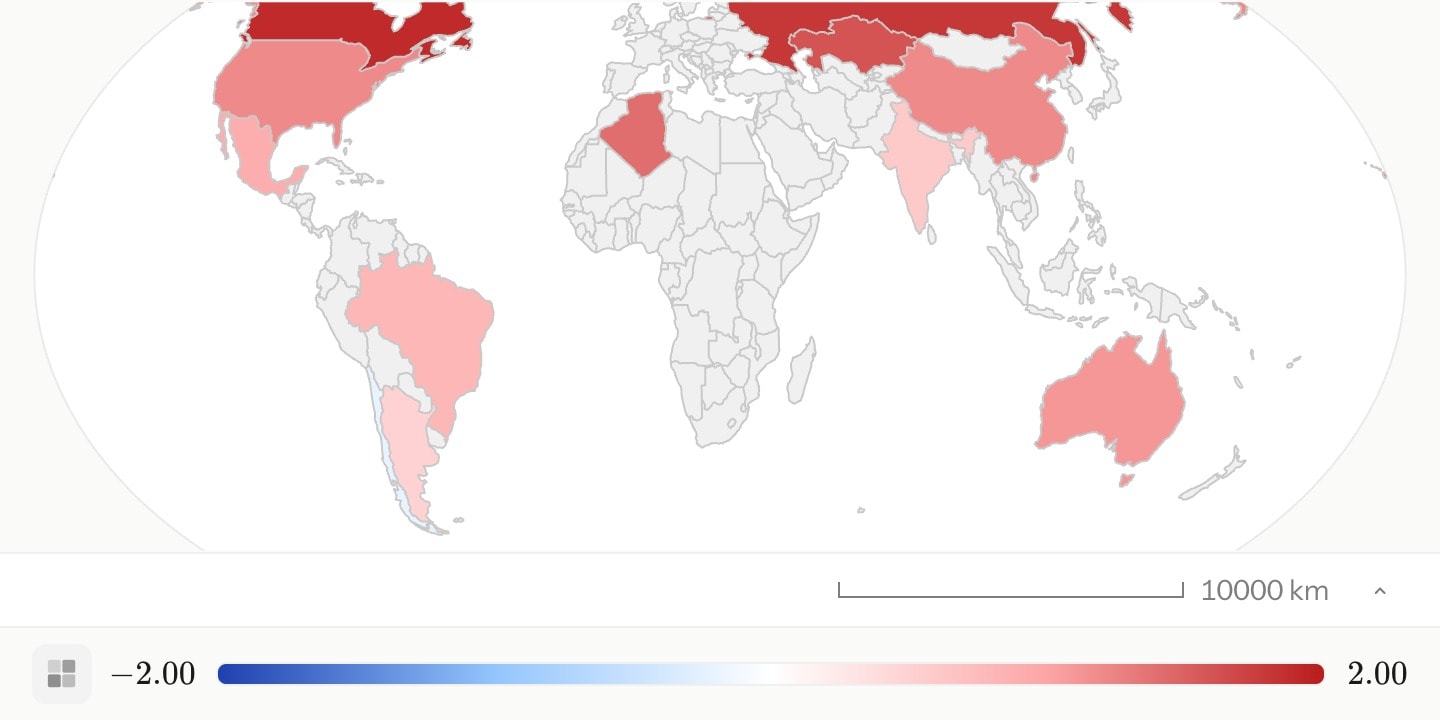
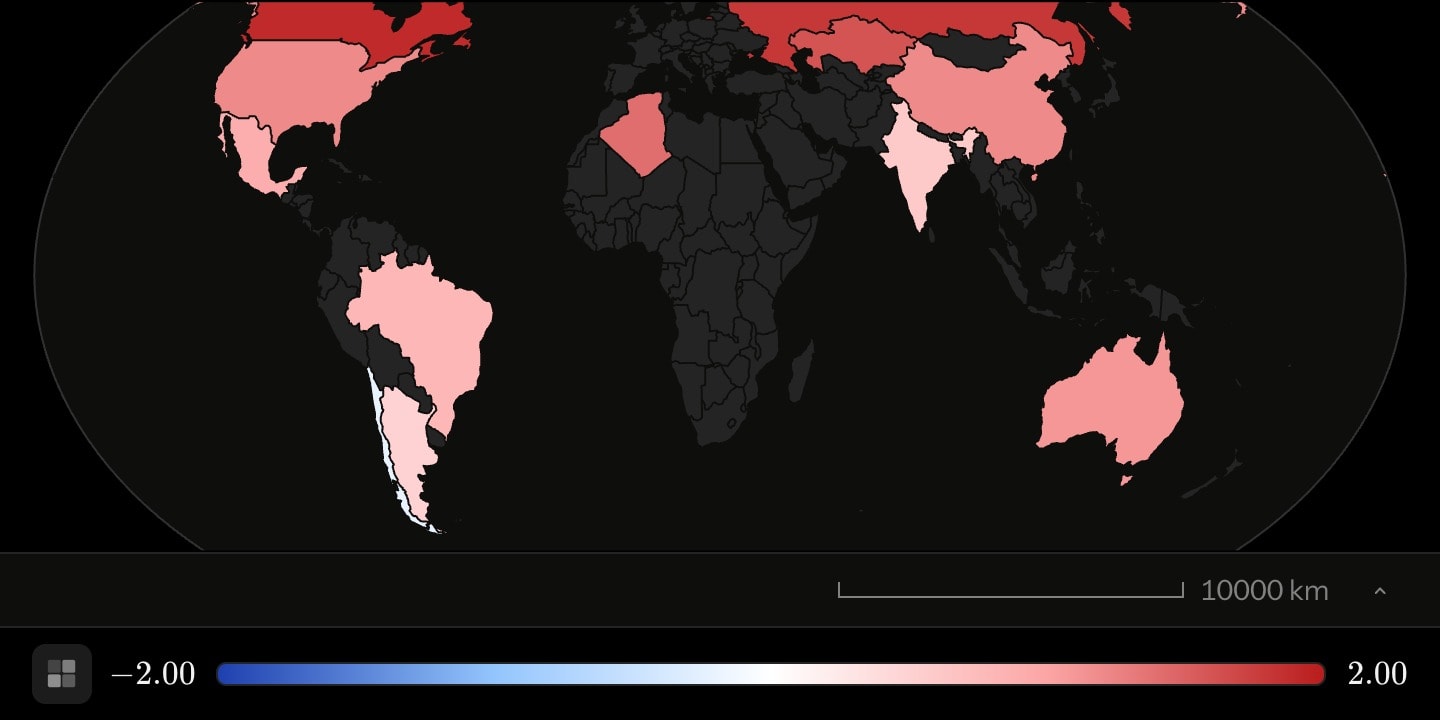
region:world{
    choropleth(basemap: world; regions: #anomaly.country; values: #anomaly.delta; colour: temperature; range: [-2, 2])
}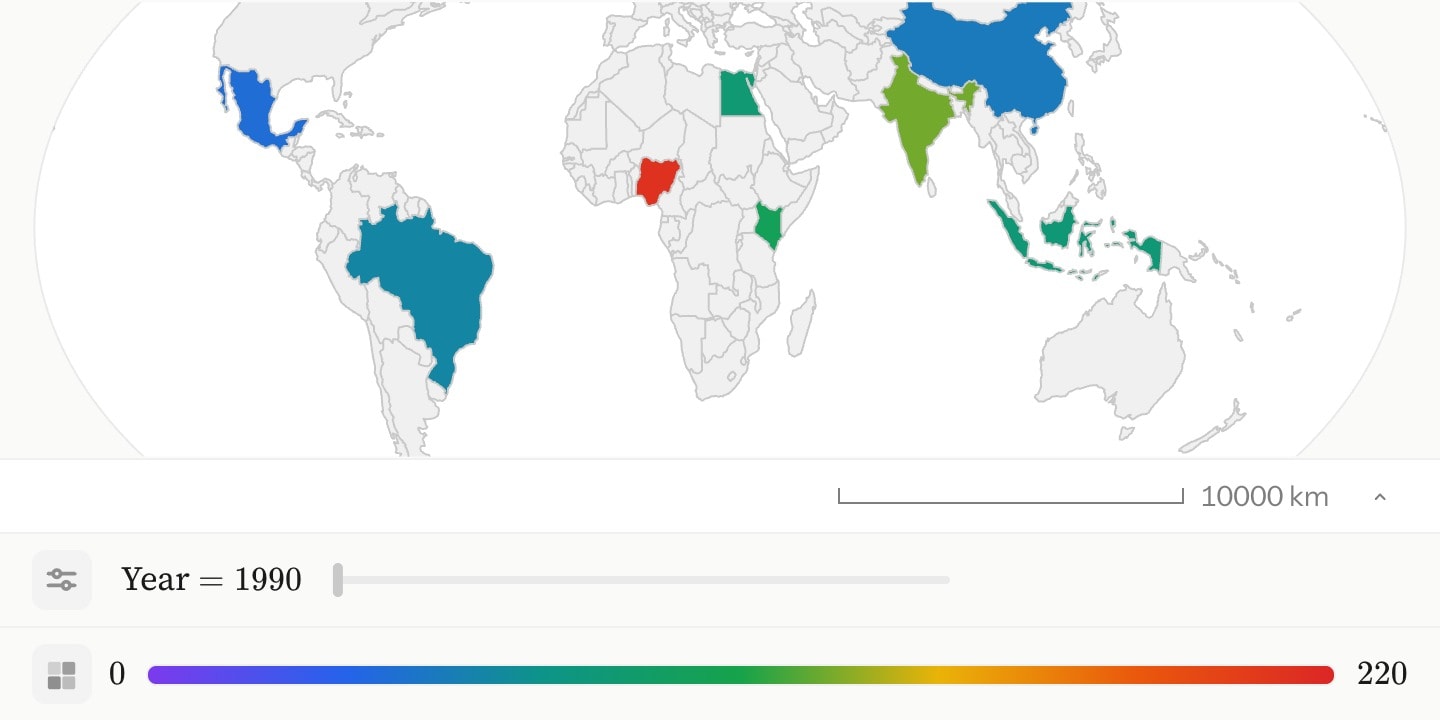
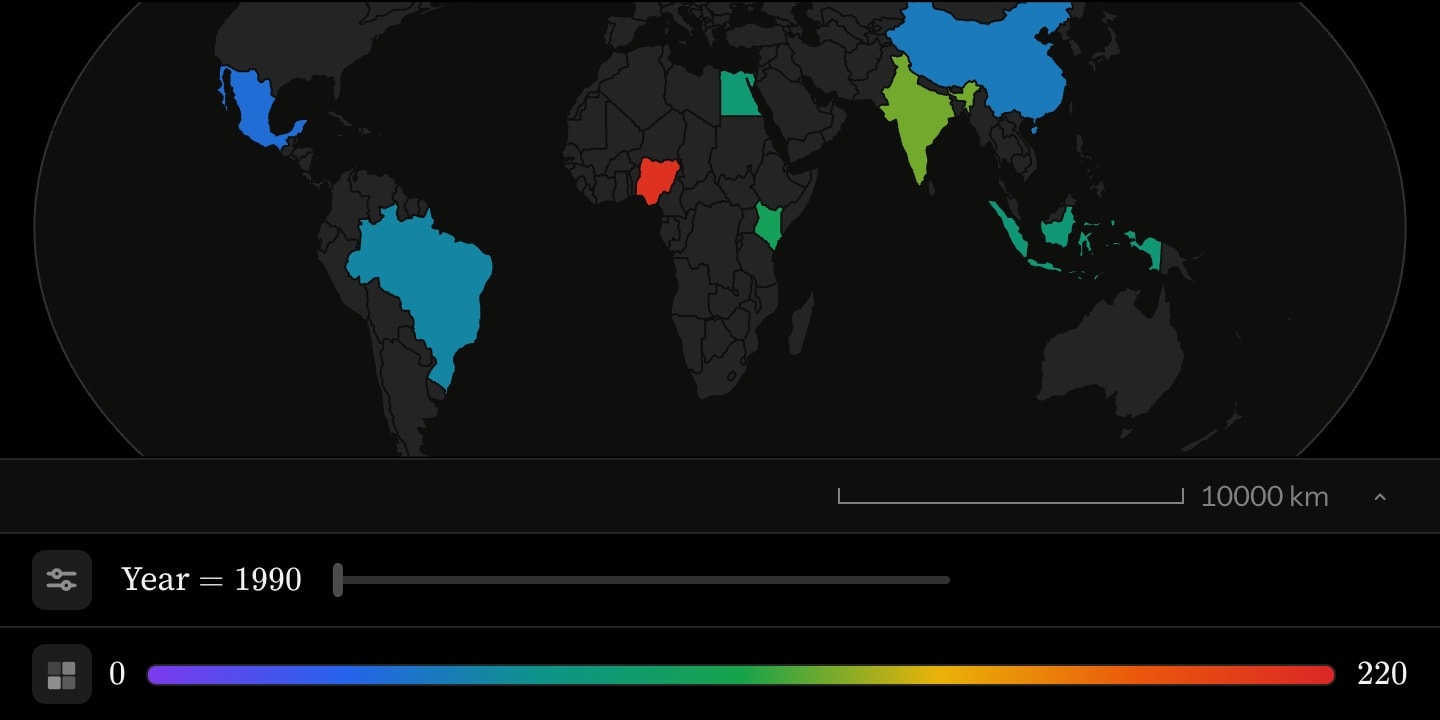
region:world{
    slider:t(column: #rates.year; name: Year)
    choropleth(regions: #rates.country; values: #rates.rate; slice: #rates.year; range: [0, 220])
}#Notes
- A region the join does not cover keeps the plain land fill.
- A
values:column of words compiles but shades nothing. - The legend gives a strip for each scale.