marker
A point on the earth, placed singly or one per row of a dataset.
marker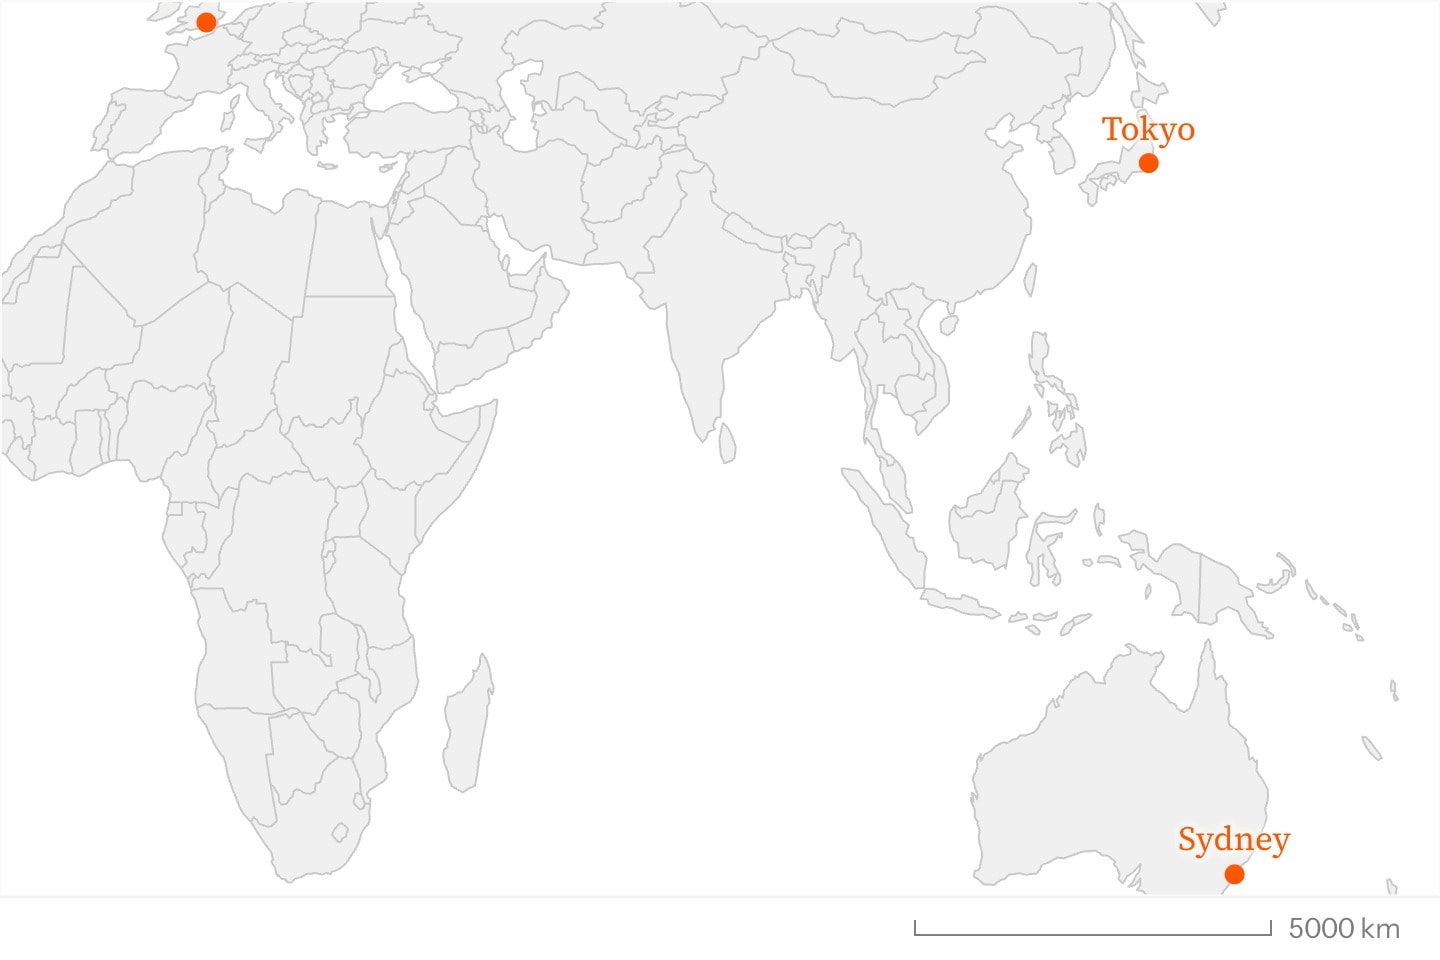
#Attributes
atThe place, latitude first:
at: 35.68, 139.69. Either half may be a parametised expression, and the pair is animatable with !cue.to. Omit it and give lat: and lon: instead for the data-bound form.Can be written as shorthand:
marker:valuelatData-bound form: the
lat: #quakes.lat. One symbol is drawn per row.lonData-bound form: the column of longitudes,
lon: #quakes.lon.Also written:
lngsize-byA numeric column that scales symbol AREA, not radius — which is what makes the sizes comparable by eye: the proportional-symbol map. Rows with no positive value draw nothing.
sizeThe symbol's size — the largest symbol's, when
size-by: scales the rest.Default
6colourThe symbol's hue.
colourAlso written:
colorDefault
orangeopacityHow solid the symbols are,
0 to 1. Worth lowering when data-bound markers crowd each other.Default
1labelRich inline label set above the marker. Single form only — a data-bound
marker draws one symbol per row, and there is no one place to put the text.hiddenDeclared but not drawn. Animatable, so
hidden: true !cue.to{false}(at: 2) is the overlay's reveal.Default
false#Allowed in
#Examples
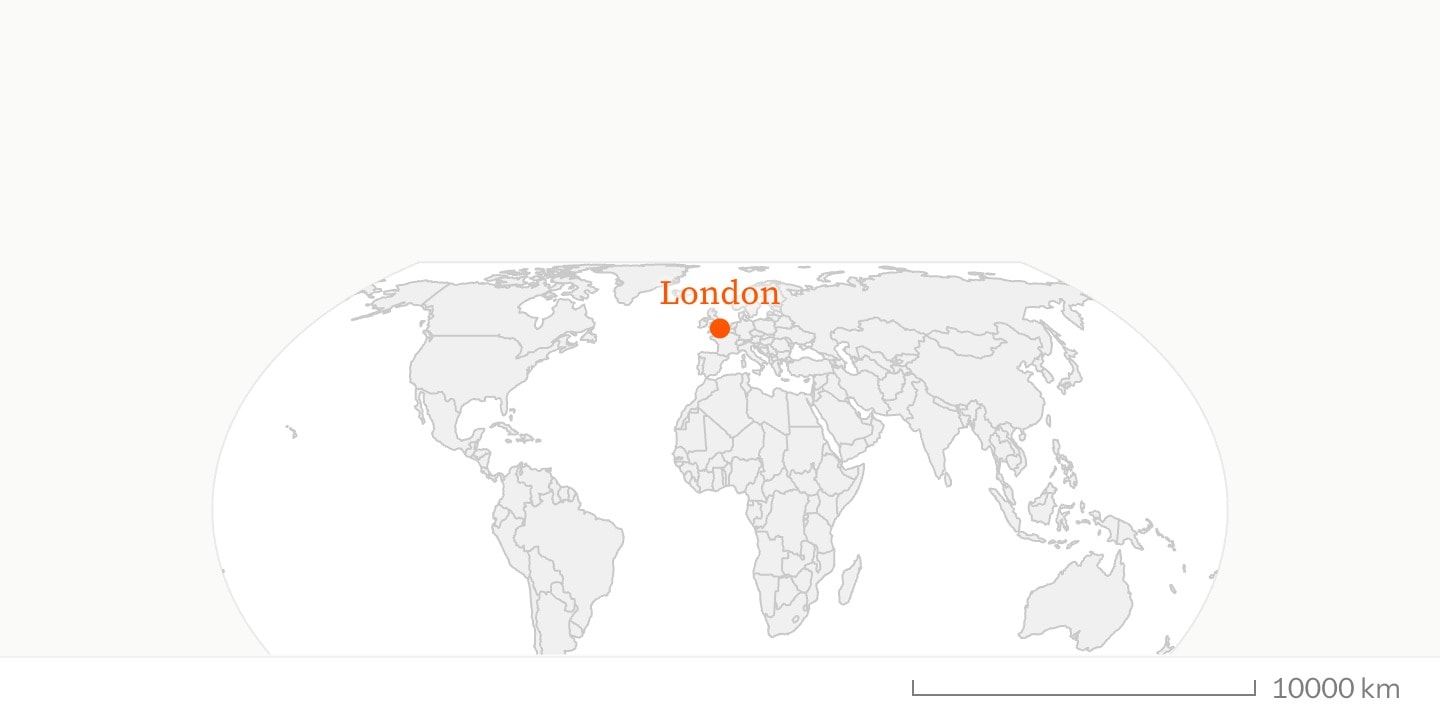
region:world{
    marker(at: 51.47, -0.46; label: London)
}
region:world{
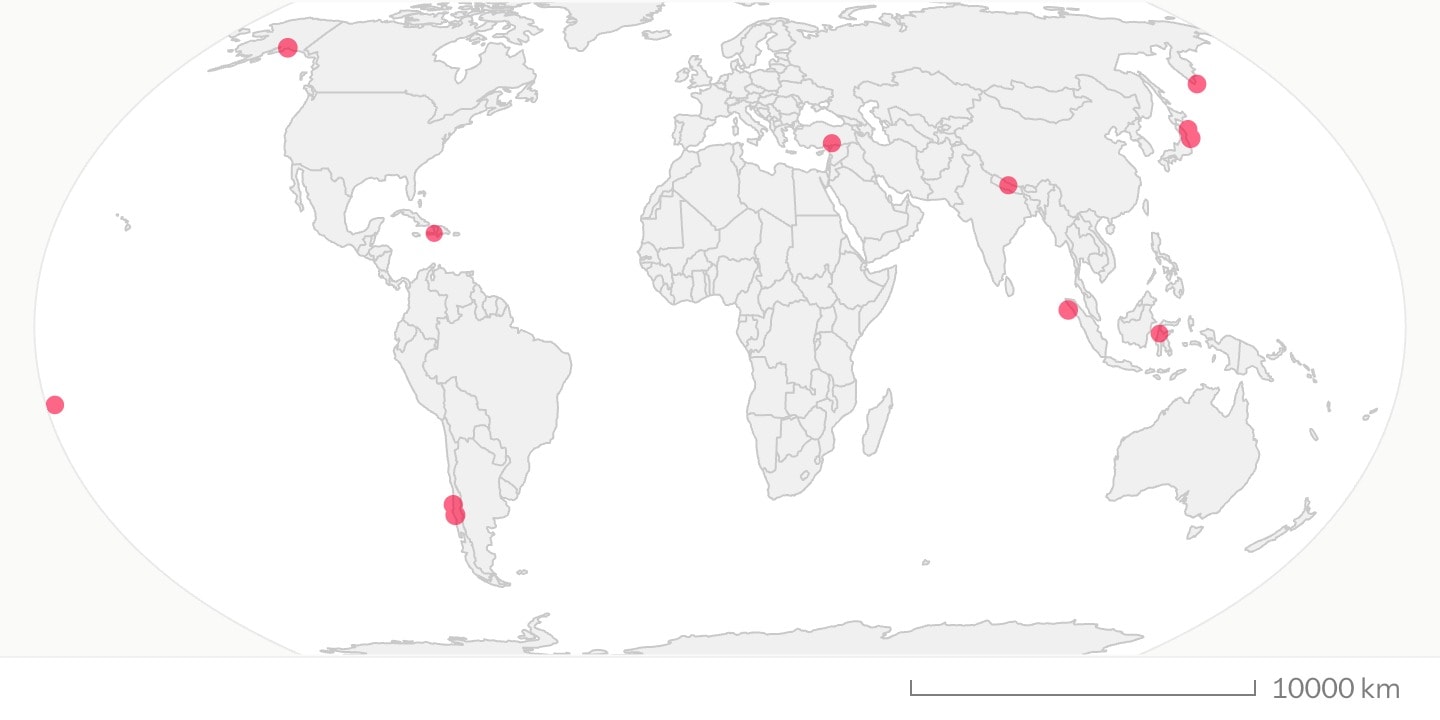
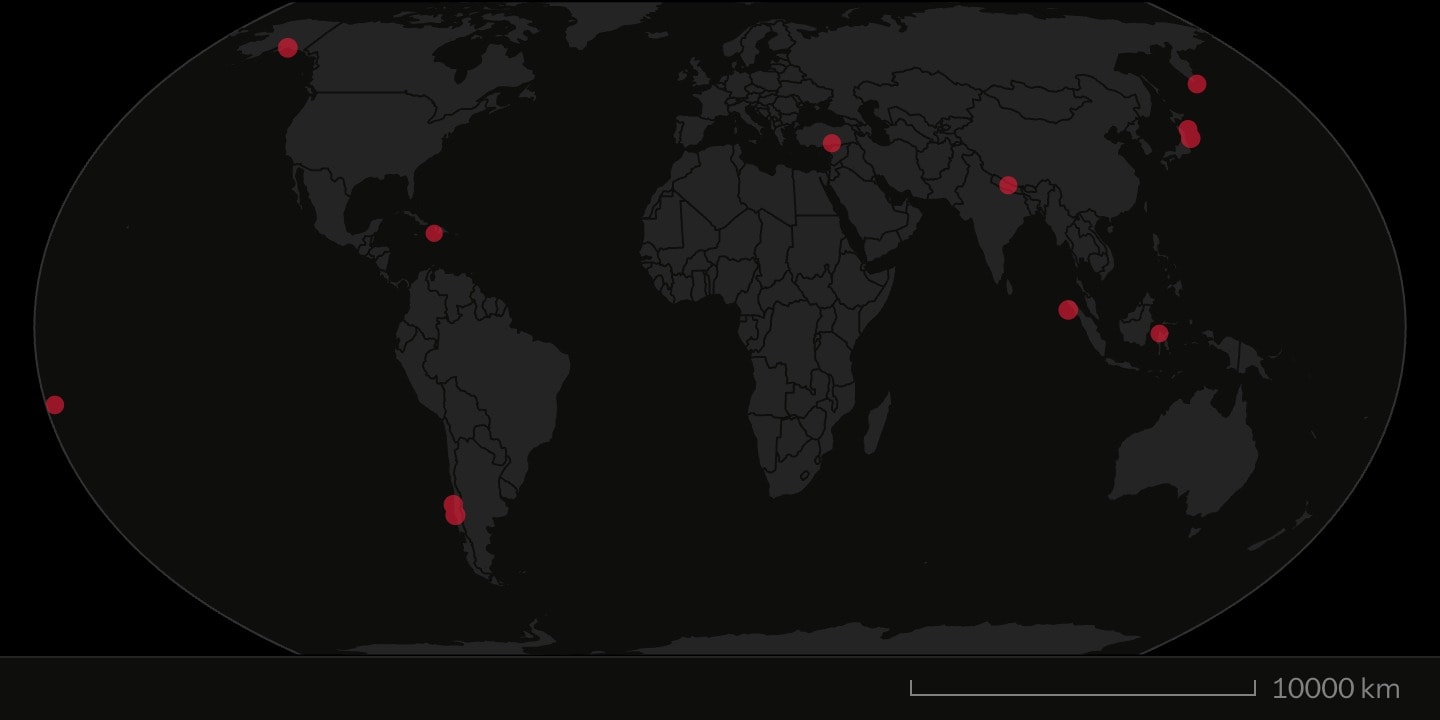
    marker(lat: #quakes.lat; lon: #quakes.lon; size-by: #quakes.magnitude; colour: red; opacity: 0.6)
}