line
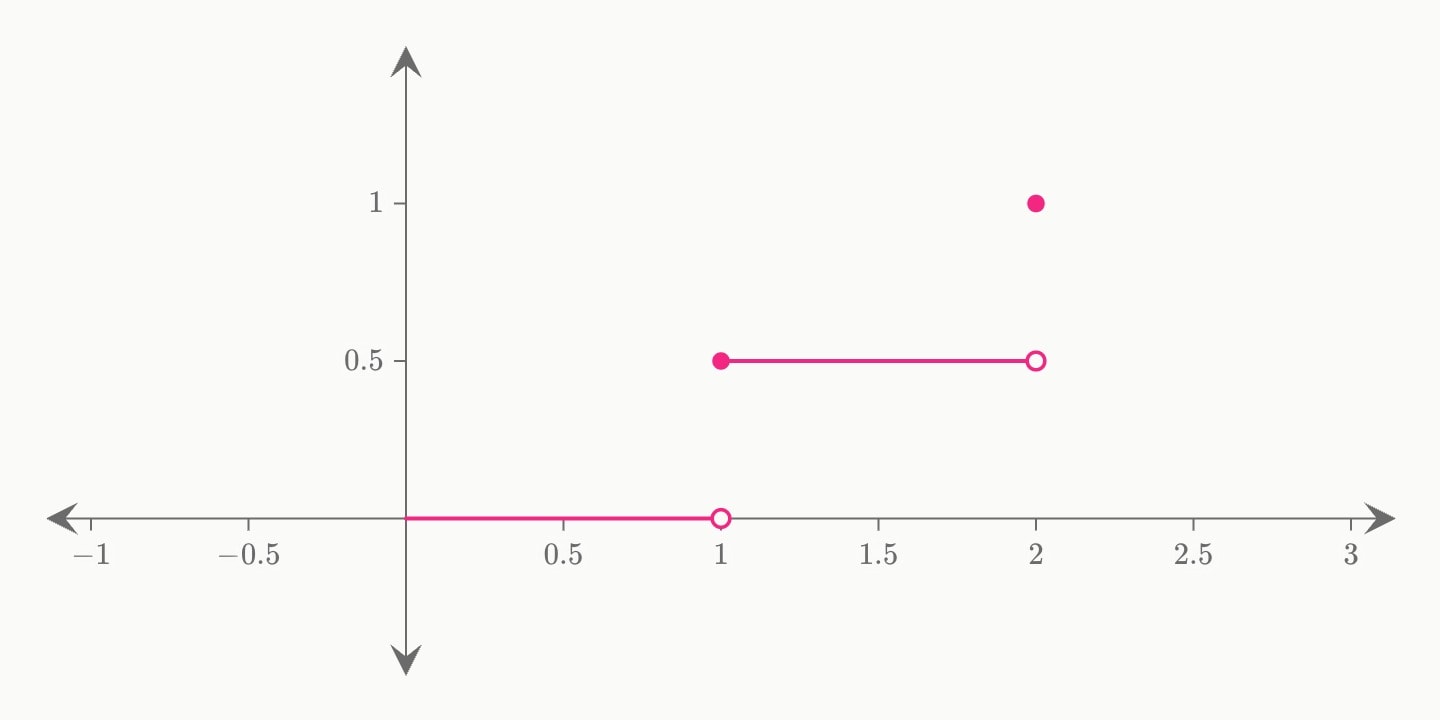
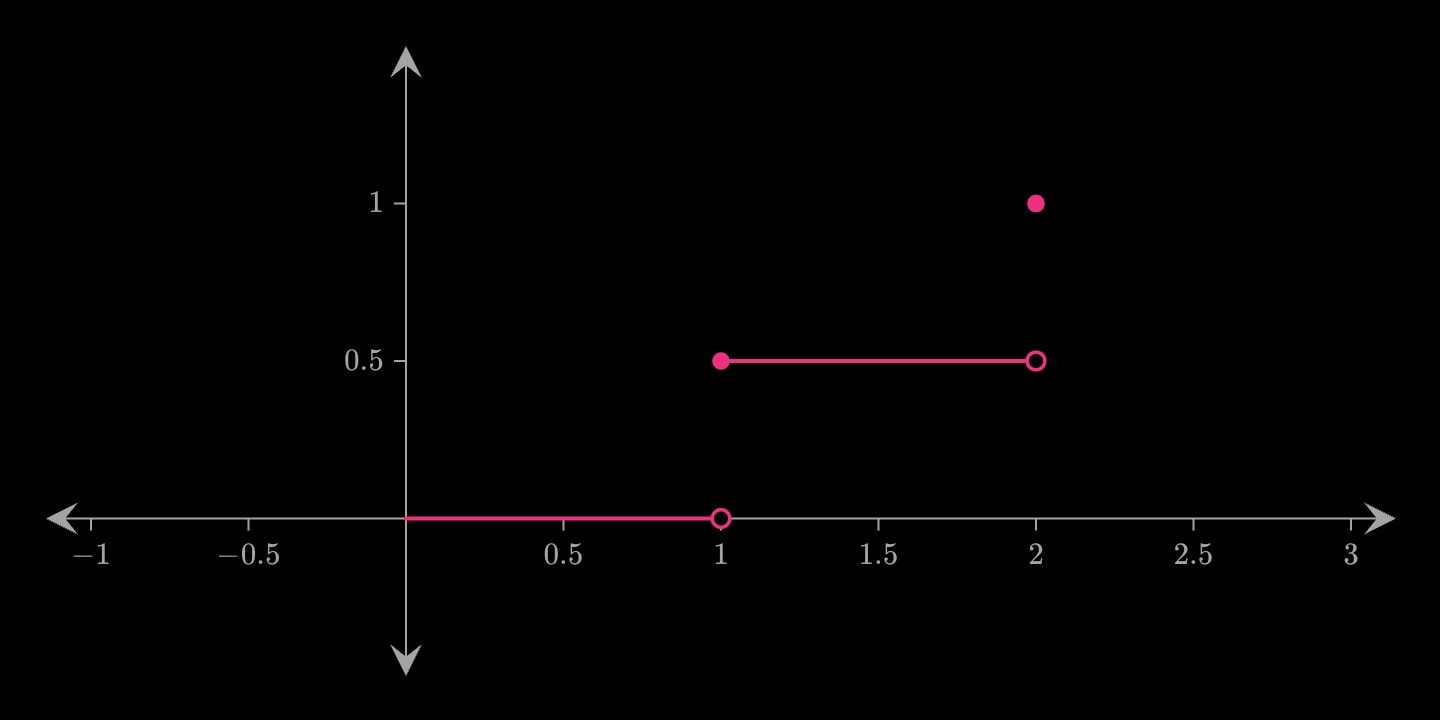
A path through a run of points. x: and y: hold one axis each, paired by position — numbers written out, or dataset columns (x: #co2.year; y: #co2.ppm). Drawn straight between the points by default; interpolate: step instead holds each value until the next x and then jumps, giving a staircase, and marks each jump with a dot: filled where the function lands, hollow where it left.
linexyargandpolarplane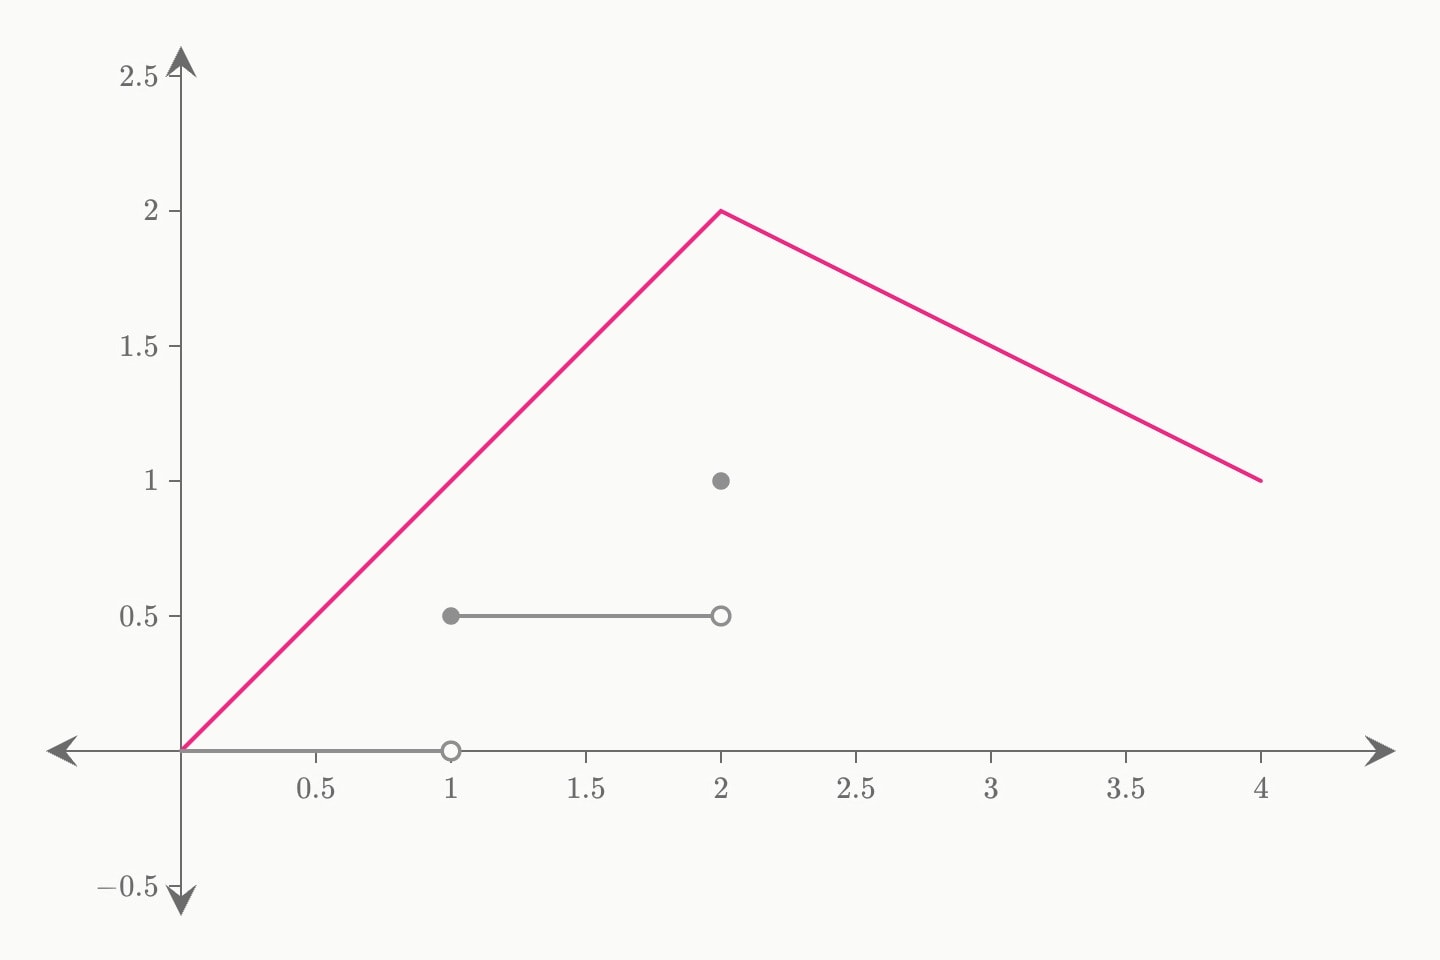
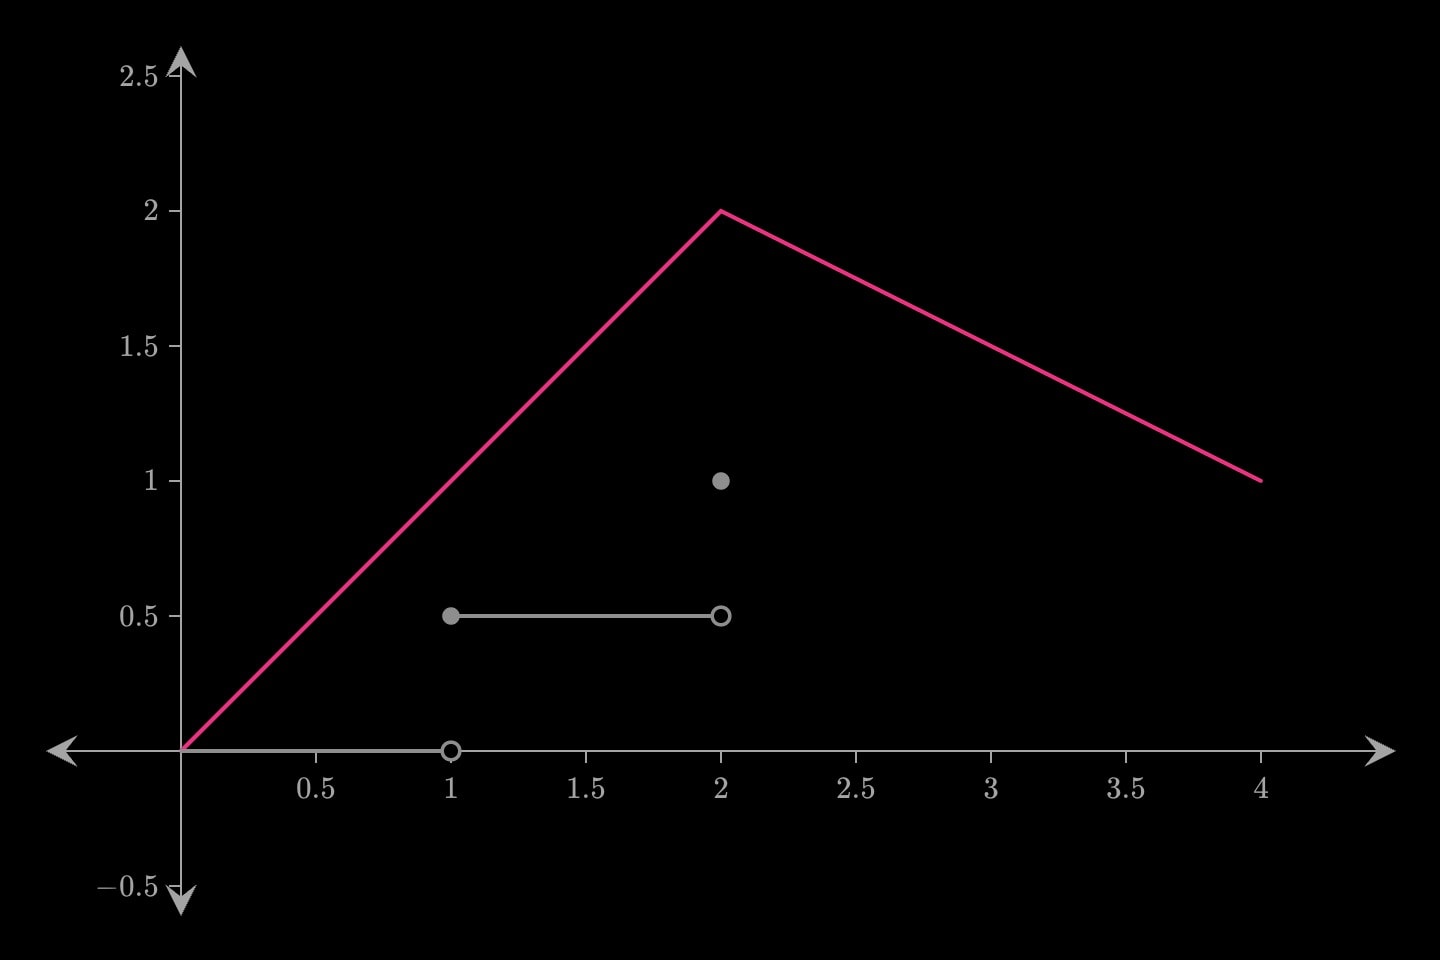
A line reads x / y the way a scatter does, and takes interpolate: linear joins the readings, bezier rounds the corners off with a cubic through every one of them, and step holds each value until the next x and then jumps. A rounded line claims the quantity varied smoothly in between, so it belongs on a trajectory and not on a tally. polygon takes linear and bezier the same way.
#Attributes
slicecolourbluelight-bluedark-blueredlight-reddark-redorangelight-orangedark-orangeyellowlight-yellowdark-yellowteallight-tealdark-tealgreenlight-greendark-greenpinklight-pinkdark-pinkpurplelight-purpledark-purplegreylight-greydark-greyneutralhex(…)rgb(…)colorpinkwidth2interpolatelinear joins them, step holds and jumps, bezier rounds the corners off with a cubic through every reading whose handles sit at the midpoints of the legs either side (t = 0.5, so it cannot overshoot). A curve says the quantity varied smoothly between the readings; a tally did not.linearstepbezierinterpolationlinearendpointsdotstruerisersconnectfalselabelhiddenfalselocklockedfalsetext-size20layerz: before the argand plane took that letter for its coordinate.xyplanex0, 1, 2 — entries may be expressions of parameters), or a dataset column (#co2.year). A column of names reads against a categorical axis (x format:, or the axis’s auto rule); an ISO date column reads as fractional years (2024-03-15 → ≈2024.2), and auto labels them in years. Paired with y by position.line:valueyx by position.argandplanez1 + i, 2 - i, -3i, a bare number a real), or a column of complex literals bound whole (#roots.z). Instead of re/im.reim by position.imre by position.#Allowed in
#Examples
canvas.graph{
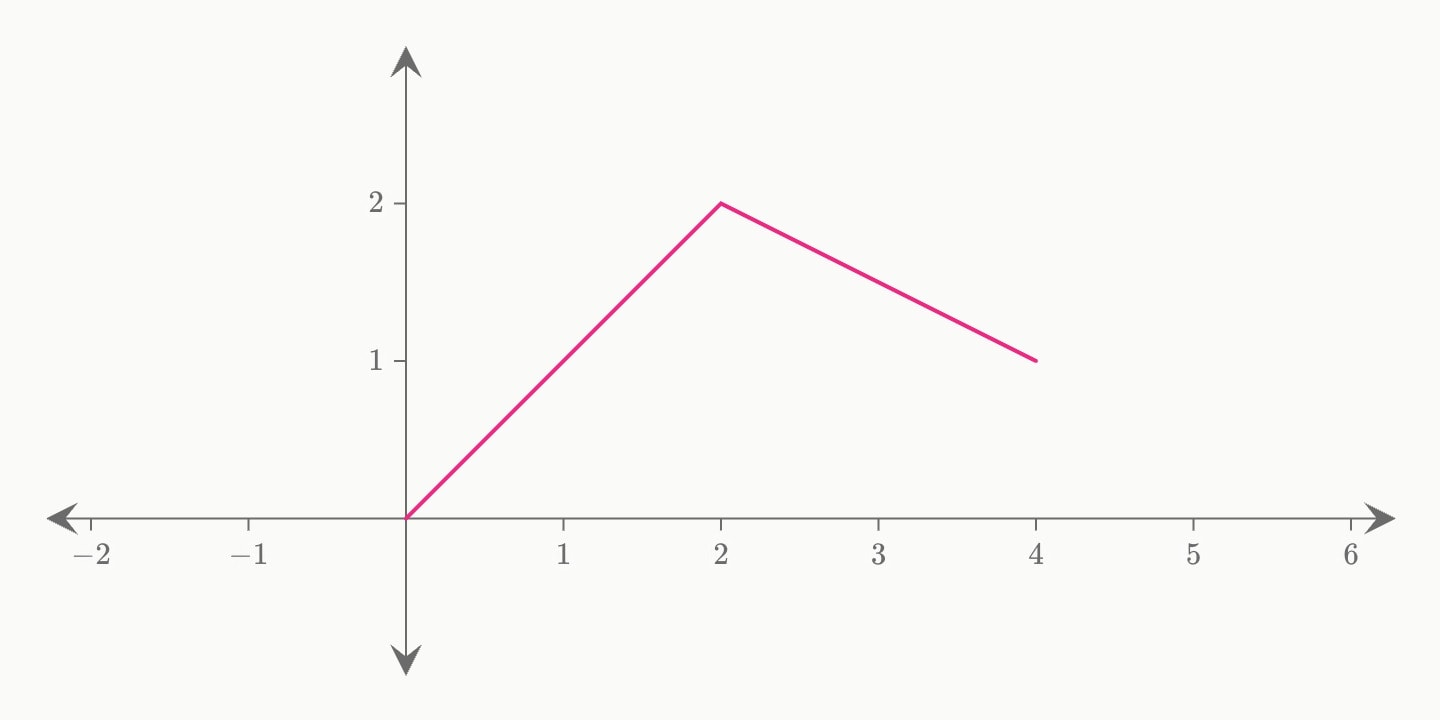
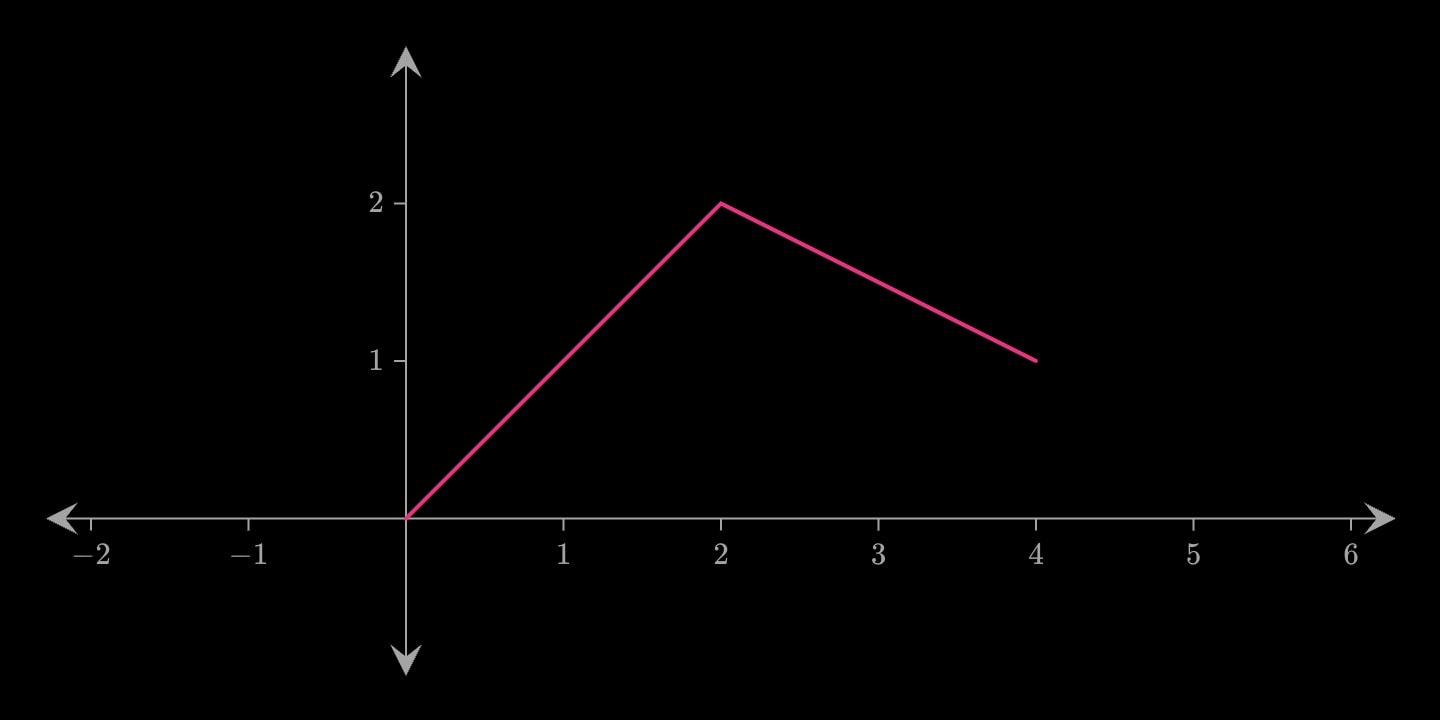
    line(x: 0, 2, 4; y: 0, 2, 1; colour: pink)
}
canvas.graph{
    line(x: 0, 1, 2; y: 0, 0.5, 1; interpolate: step)
}
canvas.graph{
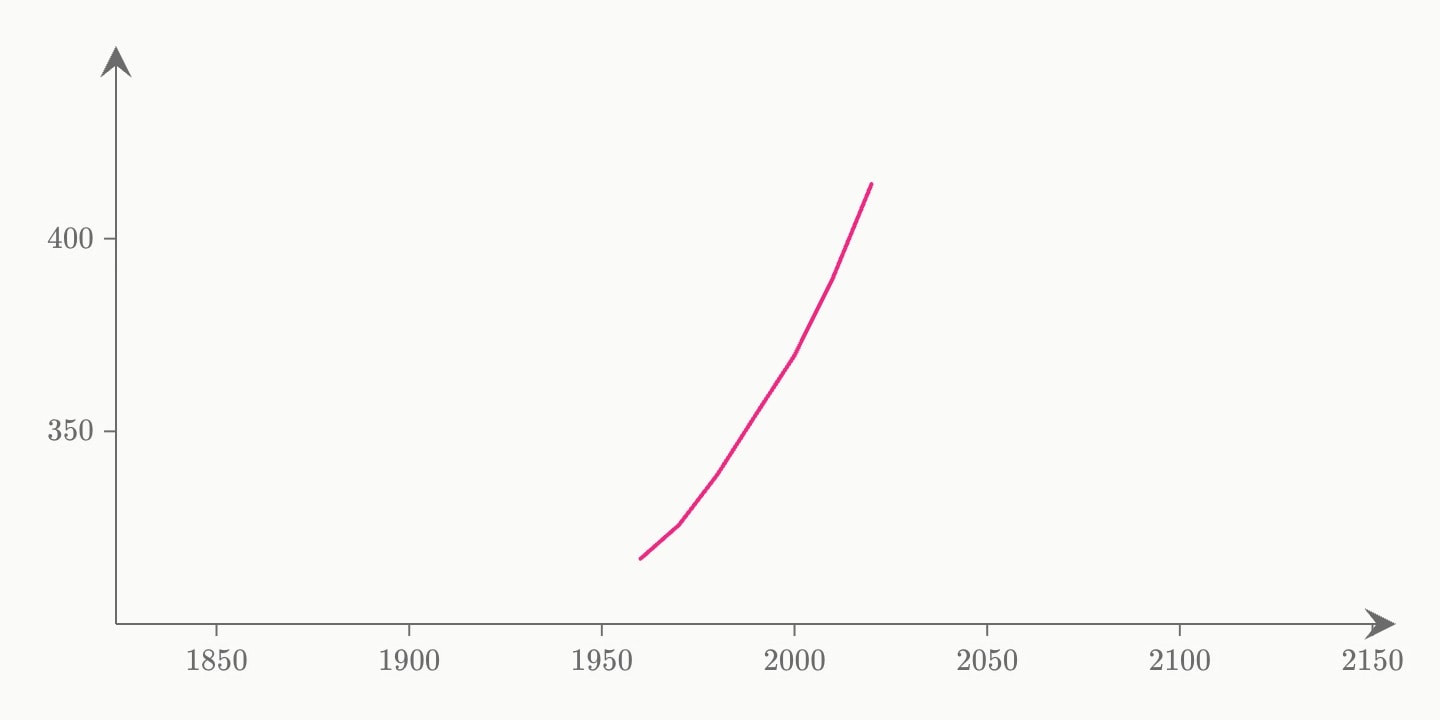
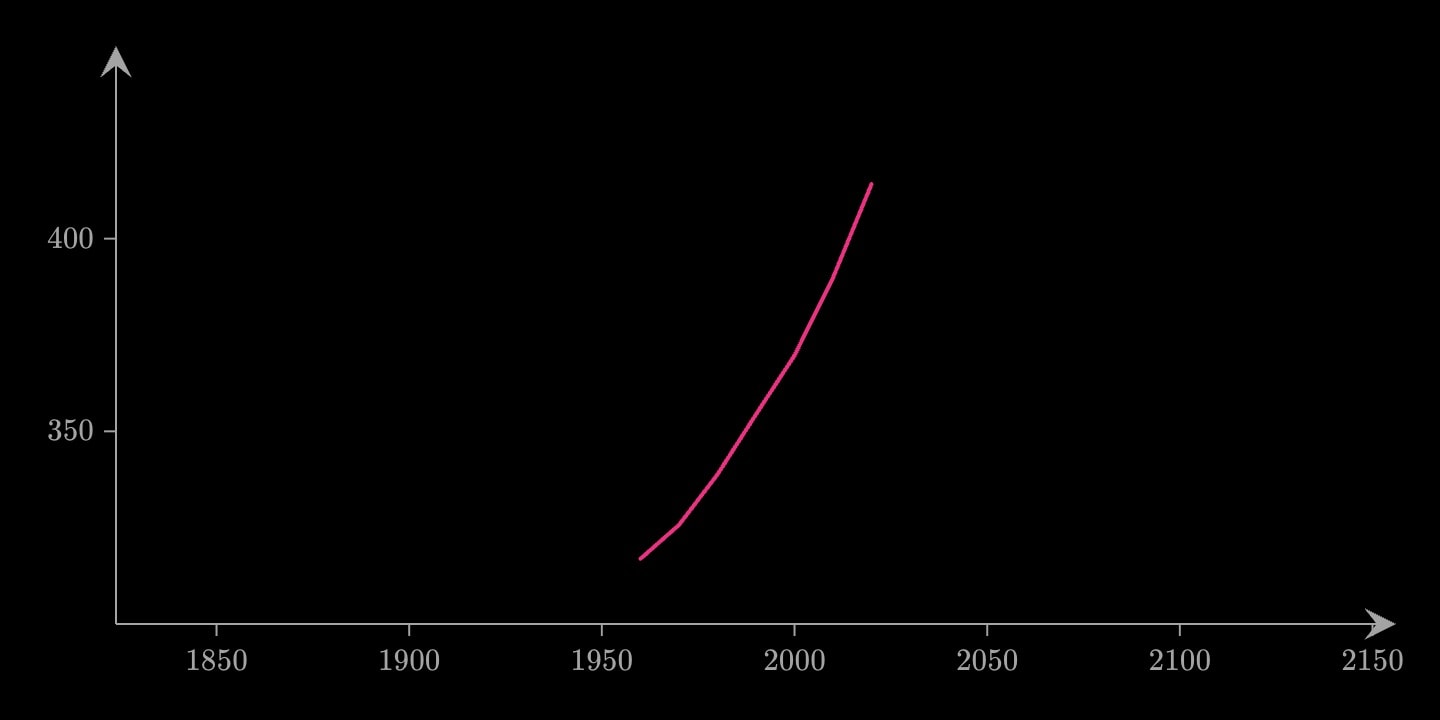
    line(x: #co2.year; y: #co2.ppm)
}