Controls
The controls that set a scene’s parameters — moved by the reader, or by the scene through a cue control — where their stops come from, and how their values read.
#Declaring a parameter
A parameter is a named value a scene holds. A control declares one and gives the reader a way to move it: slider:a(range: [0, 4]) declares a, running from 0 to 4, and puts a row for it in the scene's footer. Every expression in the scene that mentions a re-evaluates as it moves.
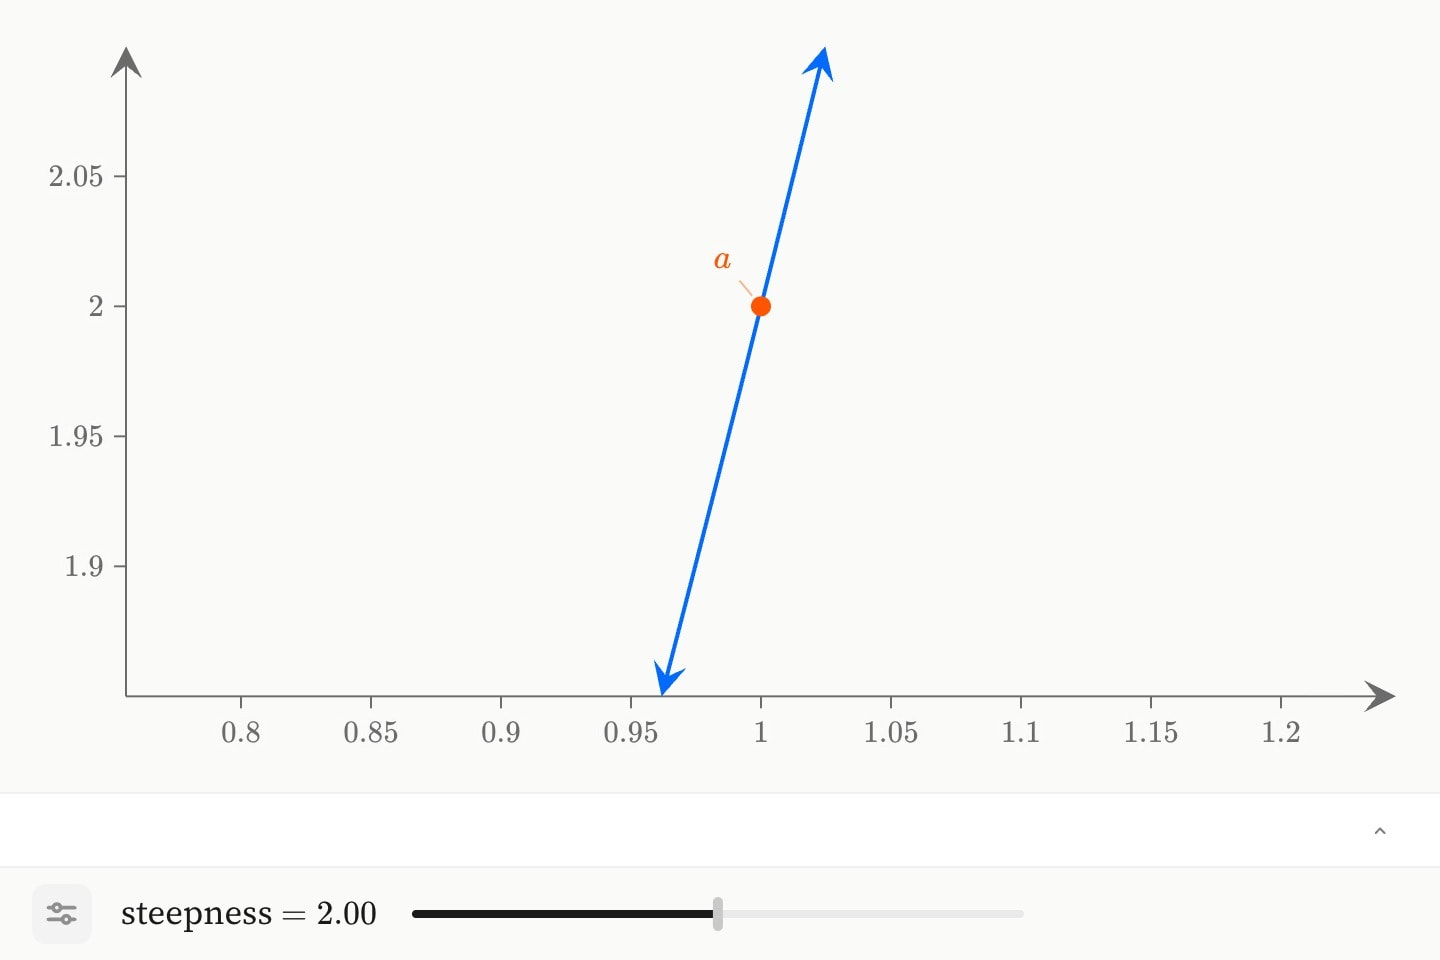
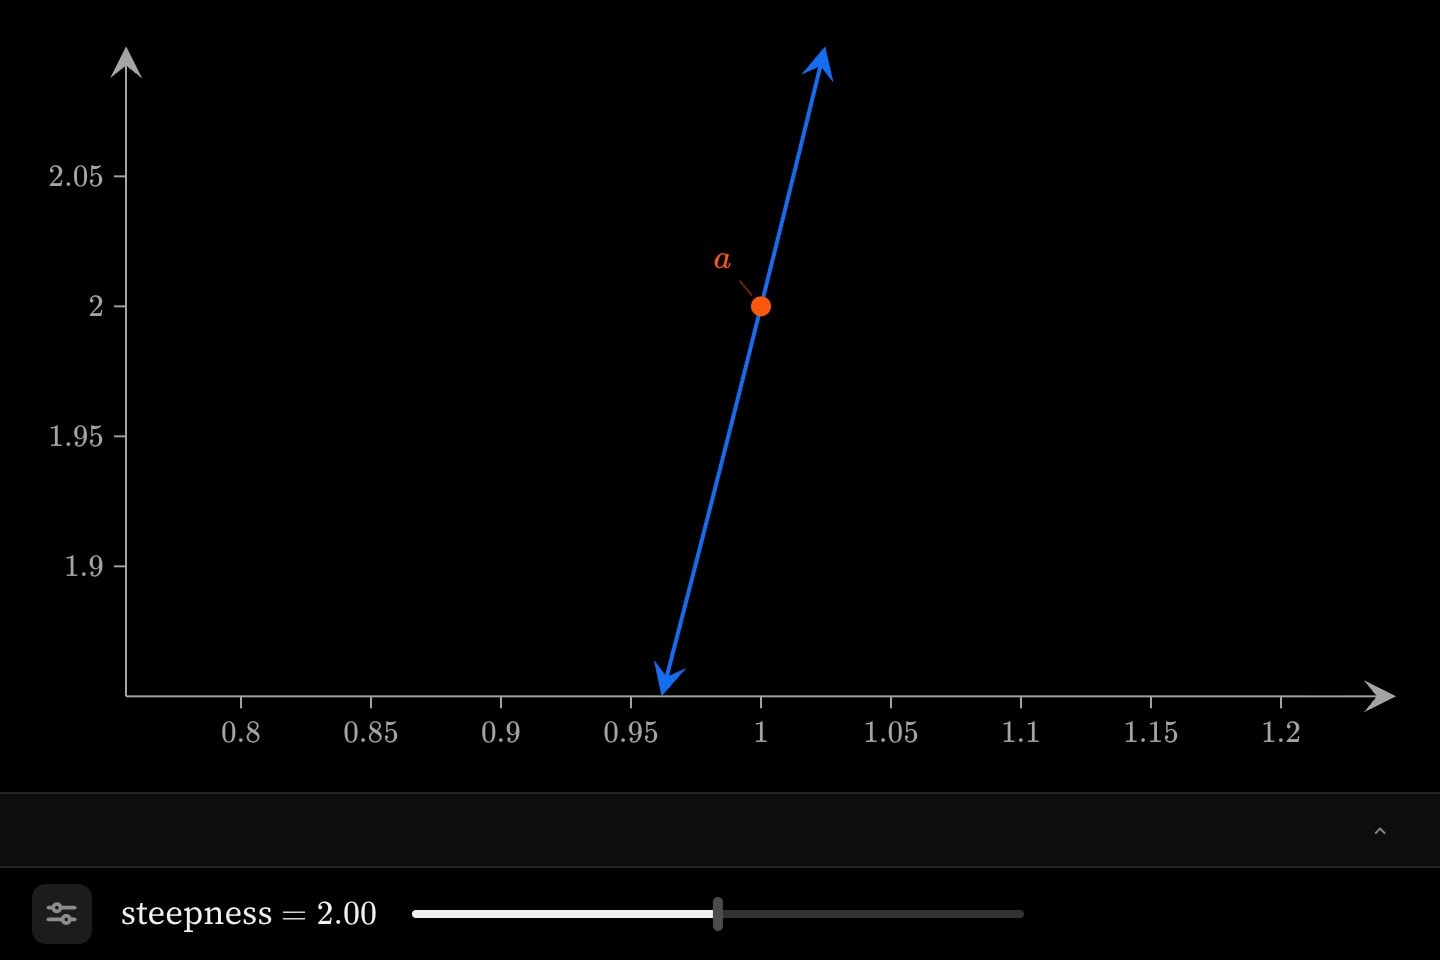
graph{
    slider:a(name: steepness; range: [0, 4]; step: 0.25; default: 2)
    curve(expression: a * x^2)
    point(x: 1; y: a; label: $a$)
}
The parameter is the scene's, not the environment's it is written in. A control may sit in any environment's body, in the scene's detail outside every environment, or inside a cue, which brings its row into the footer on that cue's step. Two graphs side by side read the same a, and one control declares it. A second control for the same name anywhere in the scene is refused:
graph{
    slider:a(range: [0, 4])
    curve(expression: a * x^2)
}
slider:a(range: [0, 2])[canvas/parameter-declared-twice]'a' is declared twice in this scene — by 'slider' and by 'slider'. A parameter belongs to the scene, so one control declares it
rate is r·a·t·e — and is the name for a parameter no expression reads: one that picks a slice of data, below.name: is what the row is labelled with in front of the reader, and is rich text, so name: Frequency $b$ sets its own maths. Without it the row is labelled with the parameter's letter.
#A letter no control declares
A letter in a graph or region expression that no control declares still gets a row: a slider from −5 to 5 in steps of 0.1, starting at 1. A control is how the author says what the letter ranges over, where it starts and what it is called.
#Where the stops come from
#Range, step and starting value
range: [start, end] sets the ends, step: the distance between stops and default: the starting value. Left out, they are [-10, 10], 1 and 0. An end may be a constant expression, range: [0, 2pi], and a default: outside the range starts at the nearer end.
The reader's track moves in steps of step:. A parameter's stops can fall off that ladder — the values of a column, below — and discrete holds it to the stops alone. On a cue.slider, discrete makes the sweep jump from stop to stop rather than glide through the gaps.
The footer draws a parameter as a track with its value beside it; under the numbers format the reader can also type the value. It draws a list instead when the values are names, or when the parameter is discrete and has between 2 and 12 stops.
#Stops written out
selector declares a parameter whose stops are written out with options:, or taken from a column with over: (below). It is always discrete, and takes no discrete:. A list of numbers gives a numeric parameter with whatever stops the list holds, in ascending order. Any entry that is not a number makes the whole list names, in the order written: [1, 2, many] is three names.
graph{
    scatter#readings(x: 1, 2, 3, 4, 5; y: 2.0, 2.4, 3.1, 4.8, 7.4)
    selector:d(name: fit degree; options: [1, 2, 3, 4])
    fit(of: #readings; degree: d)
}
A parameter can stand anywhere an attribute takes an expression, and fit's degree: is one: the fit is recomputed at whichever degree the reader picks, and its derived slope, intercept and r2 follow it.
default: is an index among them, counted from 0. Writing the opening choice first in options: does the same thing.#Stops from a column
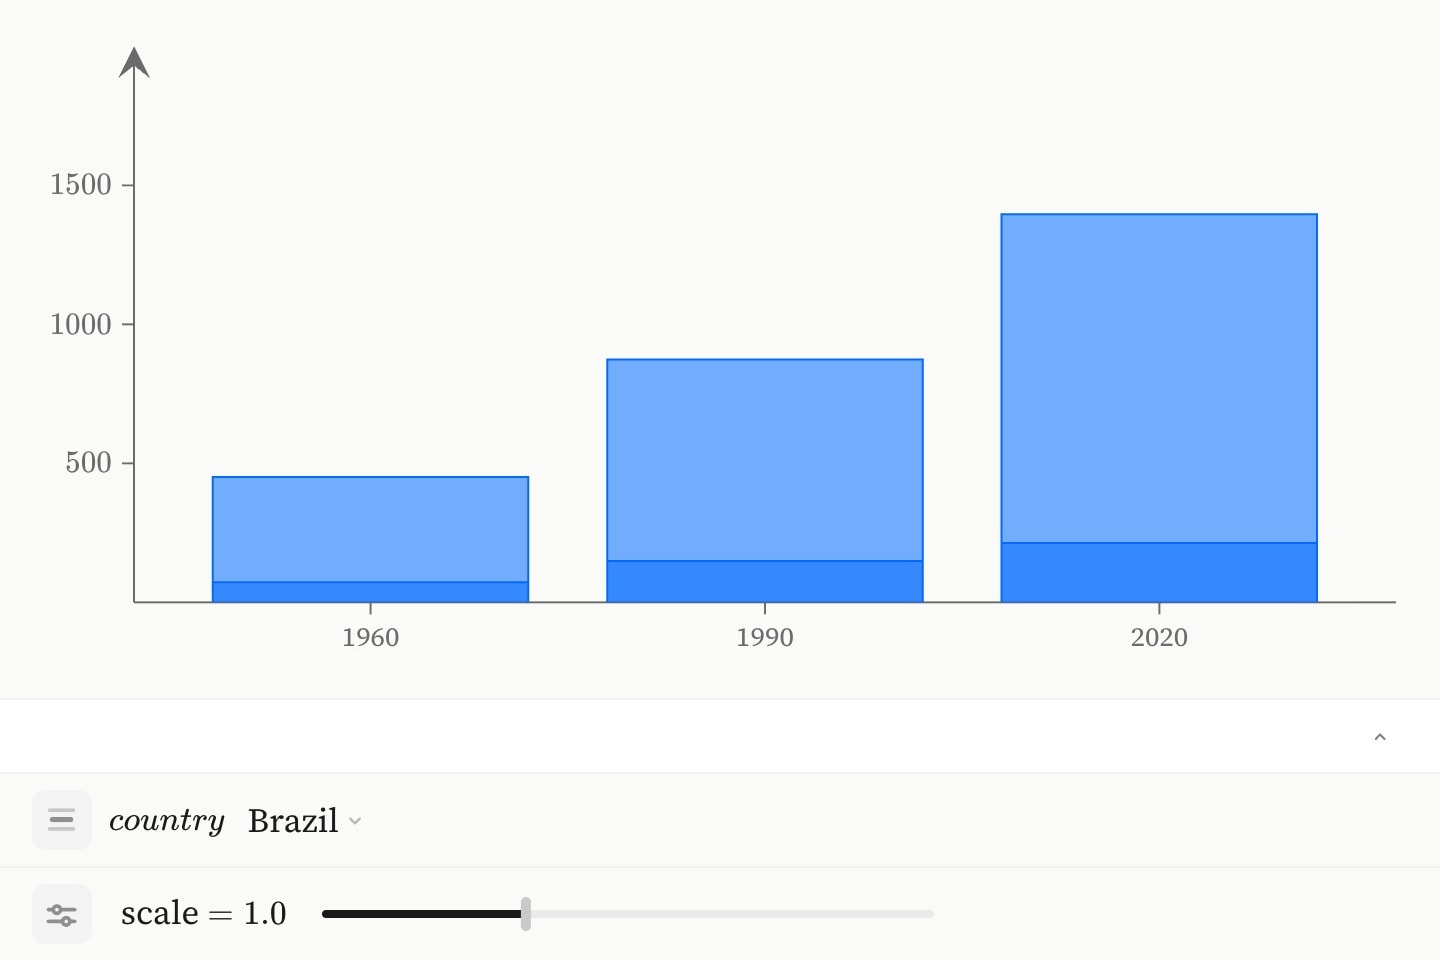
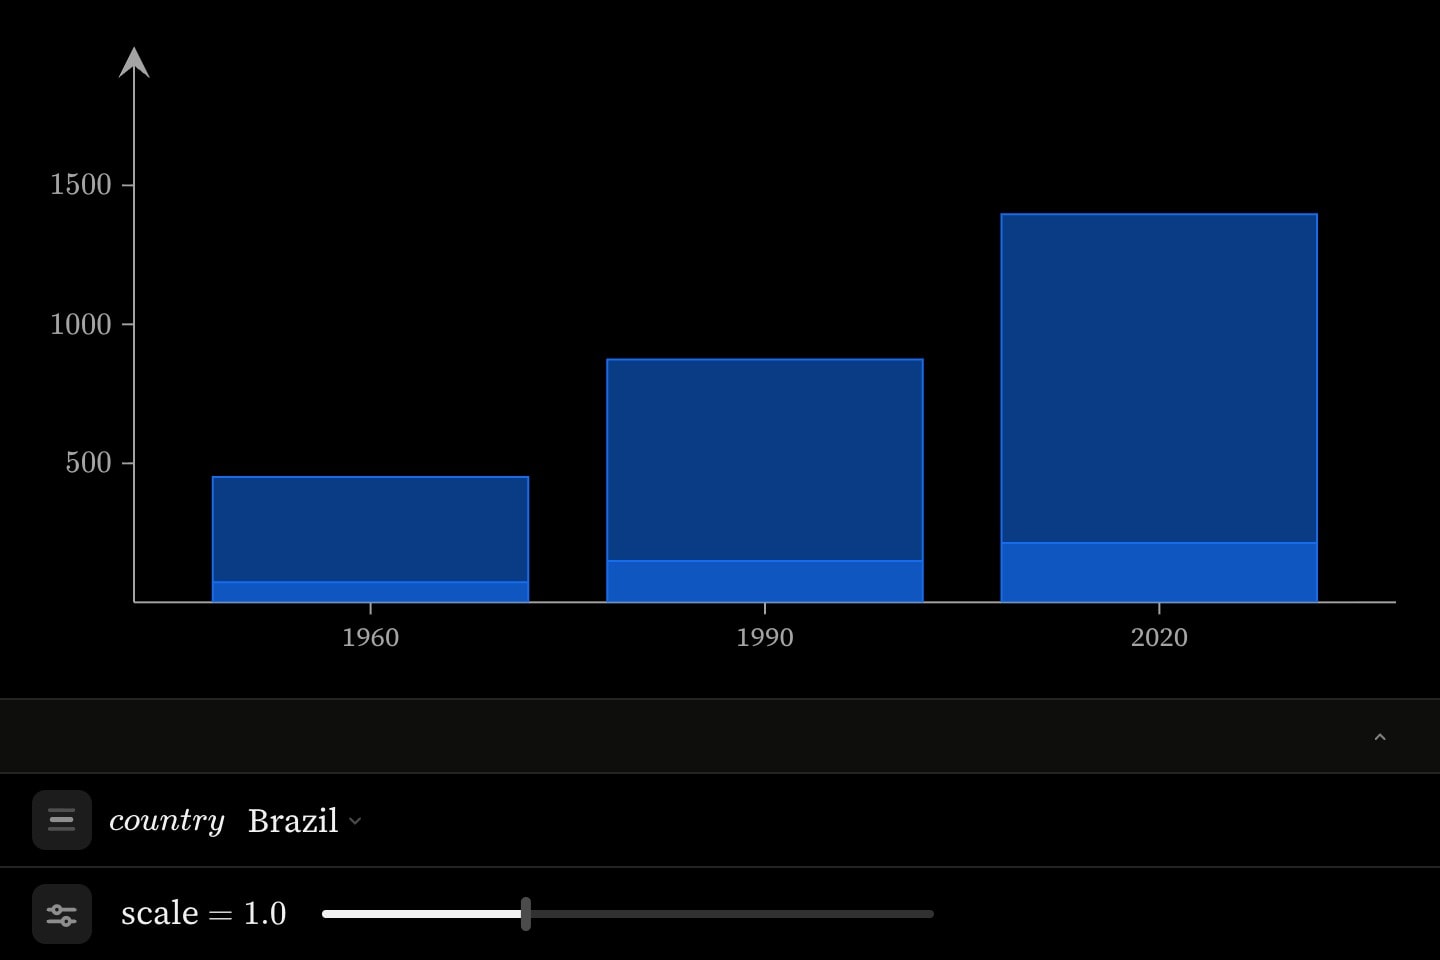
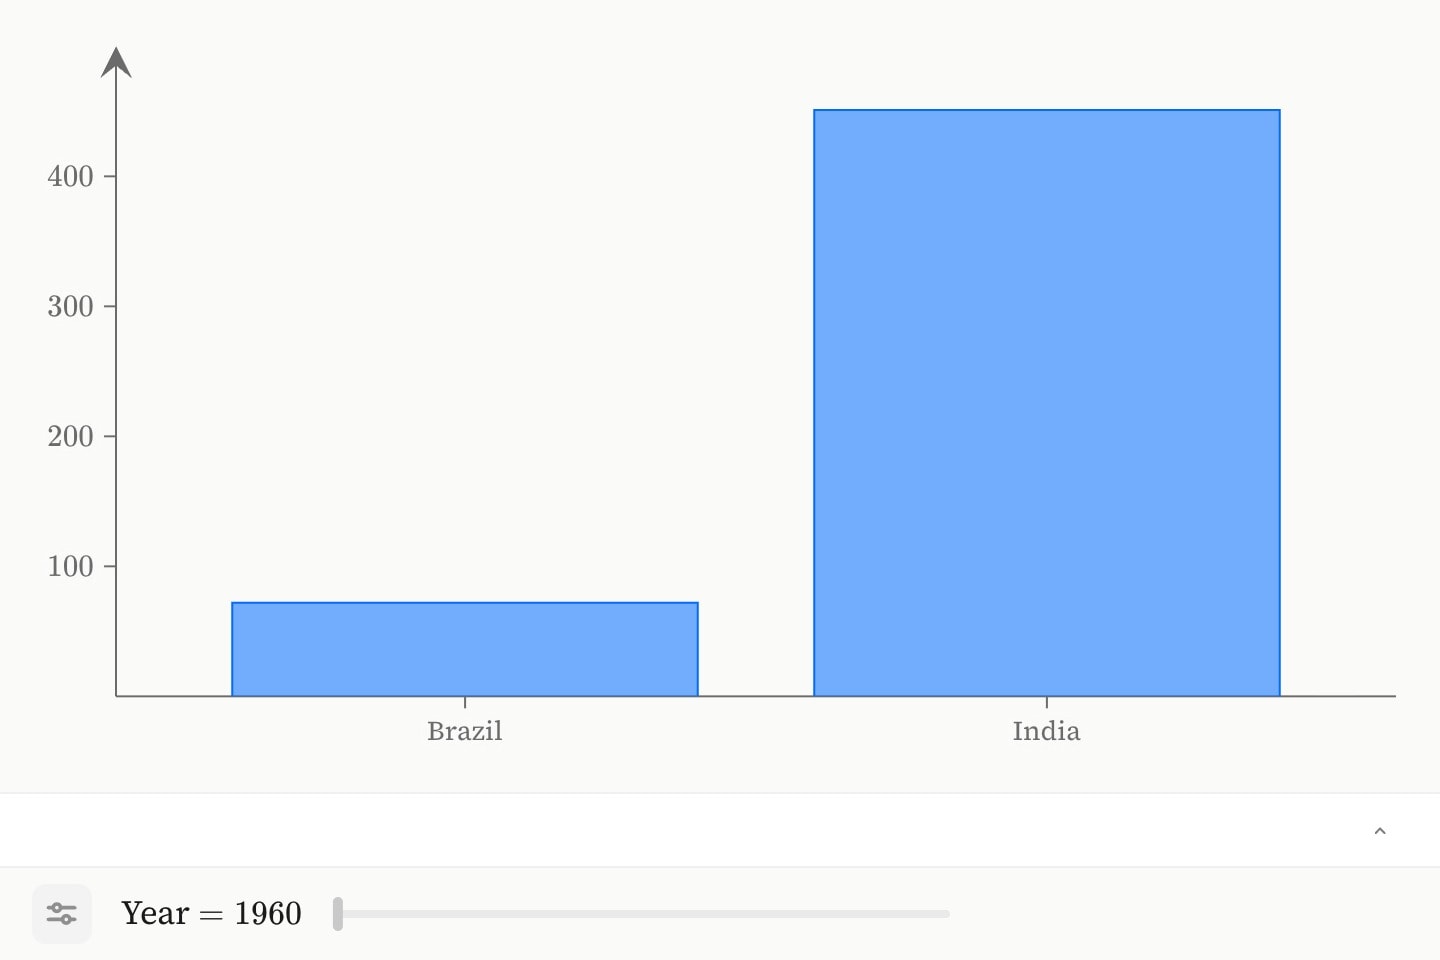
over: takes the stops from a dataset column instead. A column of numbers gives its distinct values in ascending order as the stops, the smallest and largest as the range, and the closest two values' gap as the step; the parameter starts at the smallest. A column of text gives its distinct names, in the order the rows first give them.
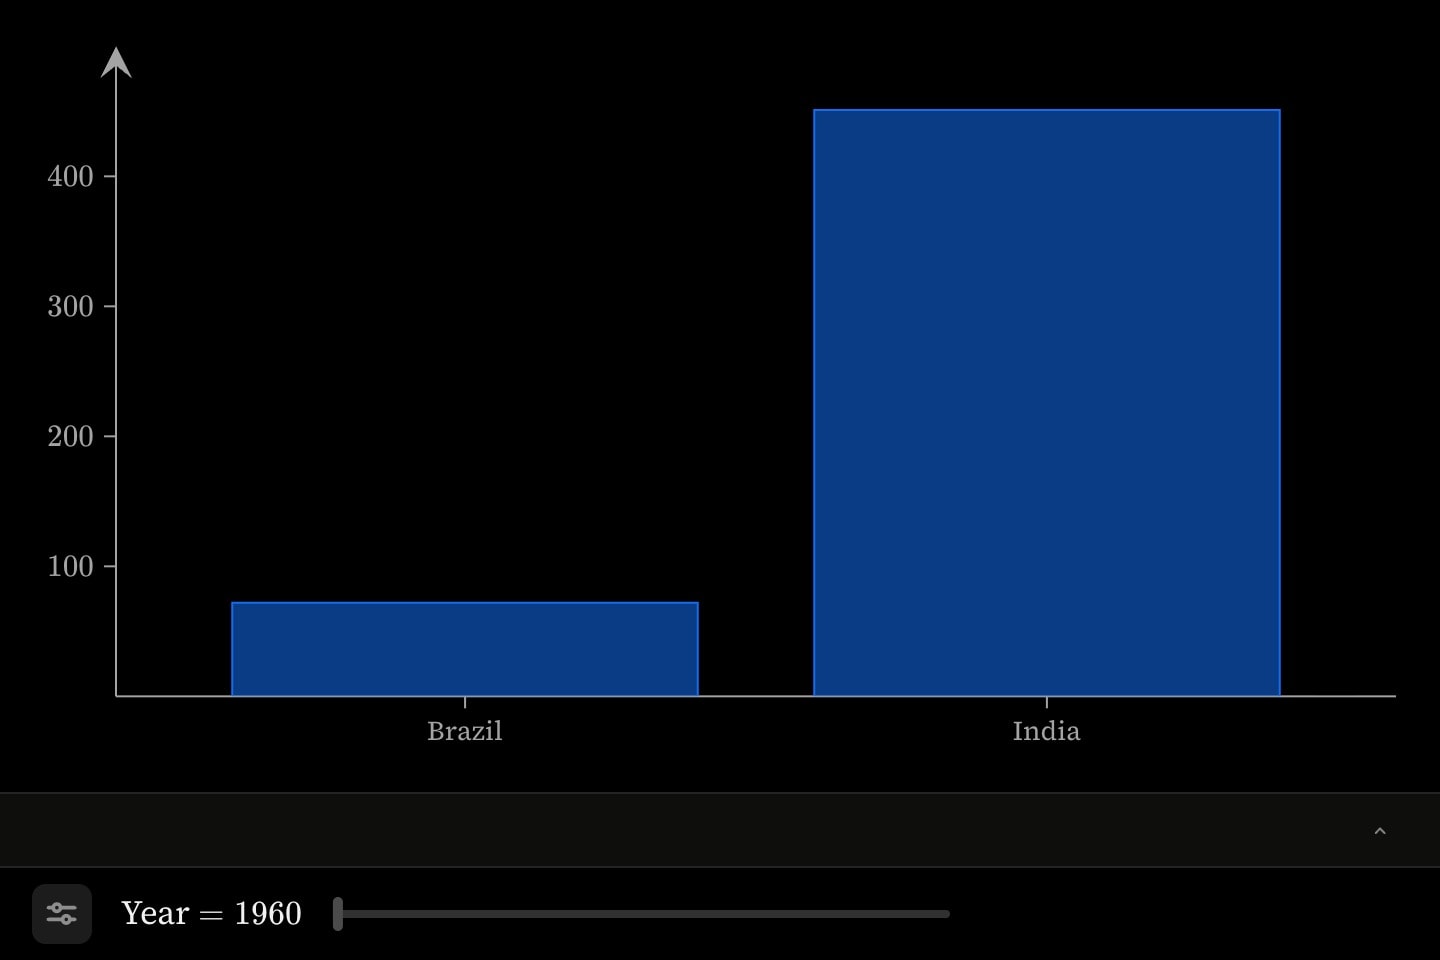
over:, range: is not read.A mark with slice: on the same column draws only the rows at the parameter's value. The mark names the column and never the parameter: the two meet at the column.
graph{
    @data#pop{
        country | year | millions
        Brazil  | 1960 | 72
        Brazil  | 1990 | 149
        Brazil  | 2020 | 213
        India   | 1960 | 451
        India   | 1990 | 873
        India   | 2020 | 1396
    }

    slider:t(over: #pop.year; name: Year)
    bar(x: #pop.country; y: #pop.millions; slice: #pop.year)
}
On a numeric column, a parameter standing between two values the data holds draws each mark at the readings interpolated between those two rows. discrete keeps it on the rows. On a column of names nothing lies between two stops, and the mark draws the rows carrying the chosen name:
@data#pop{
    country | year | millions
    Brazil  | 1960 | 72
    Brazil  | 2020 | 213
    India   | 1960 | 451
    India   | 2020 | 1396
}

graph{
    selector:country(over: #pop.country)
    bar(x: #pop.year; y: #pop.millions; slice: #pop.country)
}(
    x format: discrete
)
options: and over: are two sources for the same stops, and a control with both is refused:
selector:country(options: [Brazil, India]; over: #pop.country)[canvas/control-stops]'selector' gives both 'options:' and 'over:', which are two claims about the same list of stops; keep one
#Reading the value
#How a value reads
format: sets how the value reads in the footer. Every format but names places the value on a number line, so range: and step: stay numbers and only the readout changes.
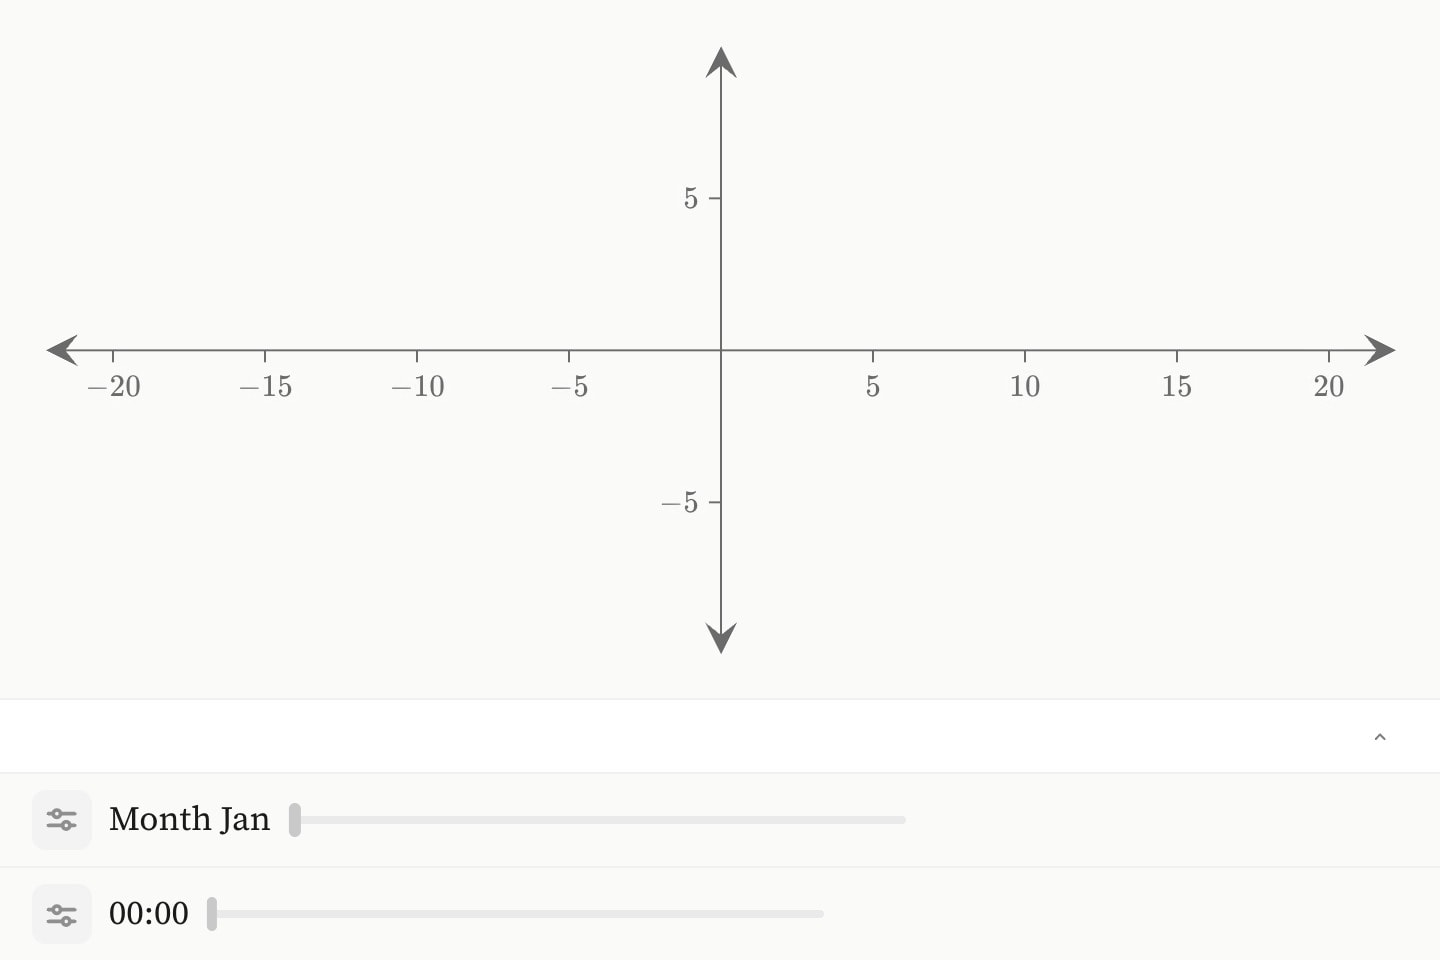
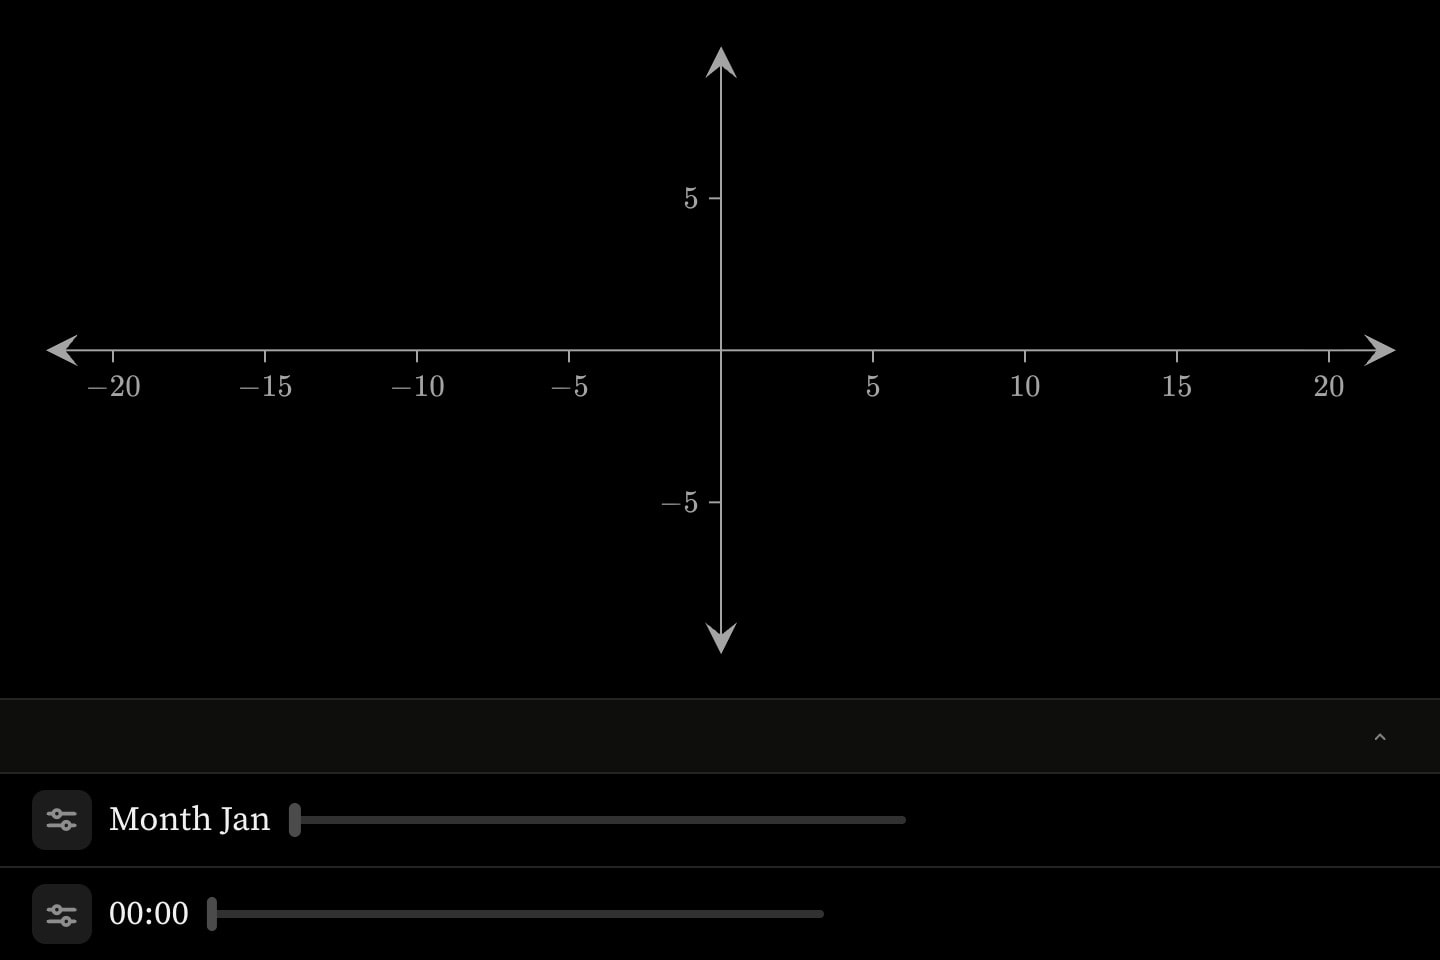
numbers— the number itself, to as many places asstep:has.dates— a year with its fraction, read as the day it falls on.months— 1 to 12, readJantoDec.weekdays— 1 to 7, readMontoSun.hours— hours from midnight, read as a clock time: 14.5 is14:30.weeks— a year with its fraction, read as a year and week:2020-W05.names— the data's own words, with no number line.
graph{
    slider:h(format: hours; range: [0, 24]; step: 0.25; default: 14.5; name: Time)
    curve(expression: 14 + 6 * sin(2 * pi * (x - 9) / 24); colour: grey)
    point(x: h; y: 14 + 6 * sin(2 * pi * (h - 9) / 24); colour: orange)
}(
    x domain: [0, 24]
    y domain: [5, 23]
)auto, the default, takes the format from the column over: names, and is numbers without one. A format: written beside over: is used instead of the column's: a column of 1 to 12 reads as numbers unless it says months.
#Reading the value in prose
Every control derives value, the parameter's current value. It is reached through the control's node id, so a control whose value the prose cites is written with one:
scene{
    At a spread of {{#spread.value}}, the curve is this wide.
}[
    graph{
        slider#spread:s(range: [0.5, 3]; step: 0.5; default: 1)
        curve(expression: exp(-x^2 / s))
    }
]
A parameter of names publishes the name itself.
#Controls the scene moves
cue.slider and cue.selector are the two controls with the scene moving the parameter. Each takes its plain twin's attributes, plus at:, the anchor the movement starts on, and duration:. Before the anchor fires, the parameter stands at its default:.
- A
cue.sliderruns from itsdefault:to the end of its range.duration:is the time for the whole range, 8s when left out, so adefault:part way along finishes in proportionally less.easing:islinearunless set tosmooth. - A
cue.selectorstands on each choice in turn and holds the last.duration:is the time on each choice, 2s when left out, so five choices at2stake ten seconds. It takes noeasing:.
region:world{
    choropleth(regions: #rates.country; values: #rates.rate; slice: #rates.year)
    cue.slider:t(over: #rates.year; at: 1; duration: 12s)
}
The movement is part of the step's choreography, so the step's play, pause and replay drive it. The reader keeps the control:
- Moving it while the step is still playing pauses the scene, and the parameter stays where they put it.
- Pressing play returns it to where the scene had it when they took hold, and the choreography carries on from that moment.
- Replaying the step runs every control they did not touch from its start. One they moved stays where they put it.
- Leaving the step hands every control back to the scene.
#Writing guidance
- Steps, timers, sweeps & parameters — New content on the step that introduces it, timers for timed motion, sweeps for a change the prose describes, and parameters where one sentence holds across the range.