heatmap
A grid of cells, one value each. x: and y: say which cell and value: what it holds — three series paired by row, written out or bound to dataset columns, so a long-format table of a, b, r rows is the whole mark. A correlation matrix is what it exists for, and a confusion matrix, a payoff matrix and a co-occurrence table are the same picture. BOTH AXES MUST BE RULED IN STOPS — names, or format: discrete for numbers — because a cell is the box an axis rules off and a continuous axis rules off none; a continuous axis beside a heatmap is refused (canvas/heatmap-axis). auto gets there by itself: an axis carrying nothing but cells rules itself at their values, so a grid of five loads by four speeds needs no format: line at all. Each cell then fills the band at its stop. Not a surface, which samples an expression over the whole window and has no cells at all. A cell no row names is not drawn and the plot shows through; where two rows name the same cell, the last one wins.
heatmapxyplane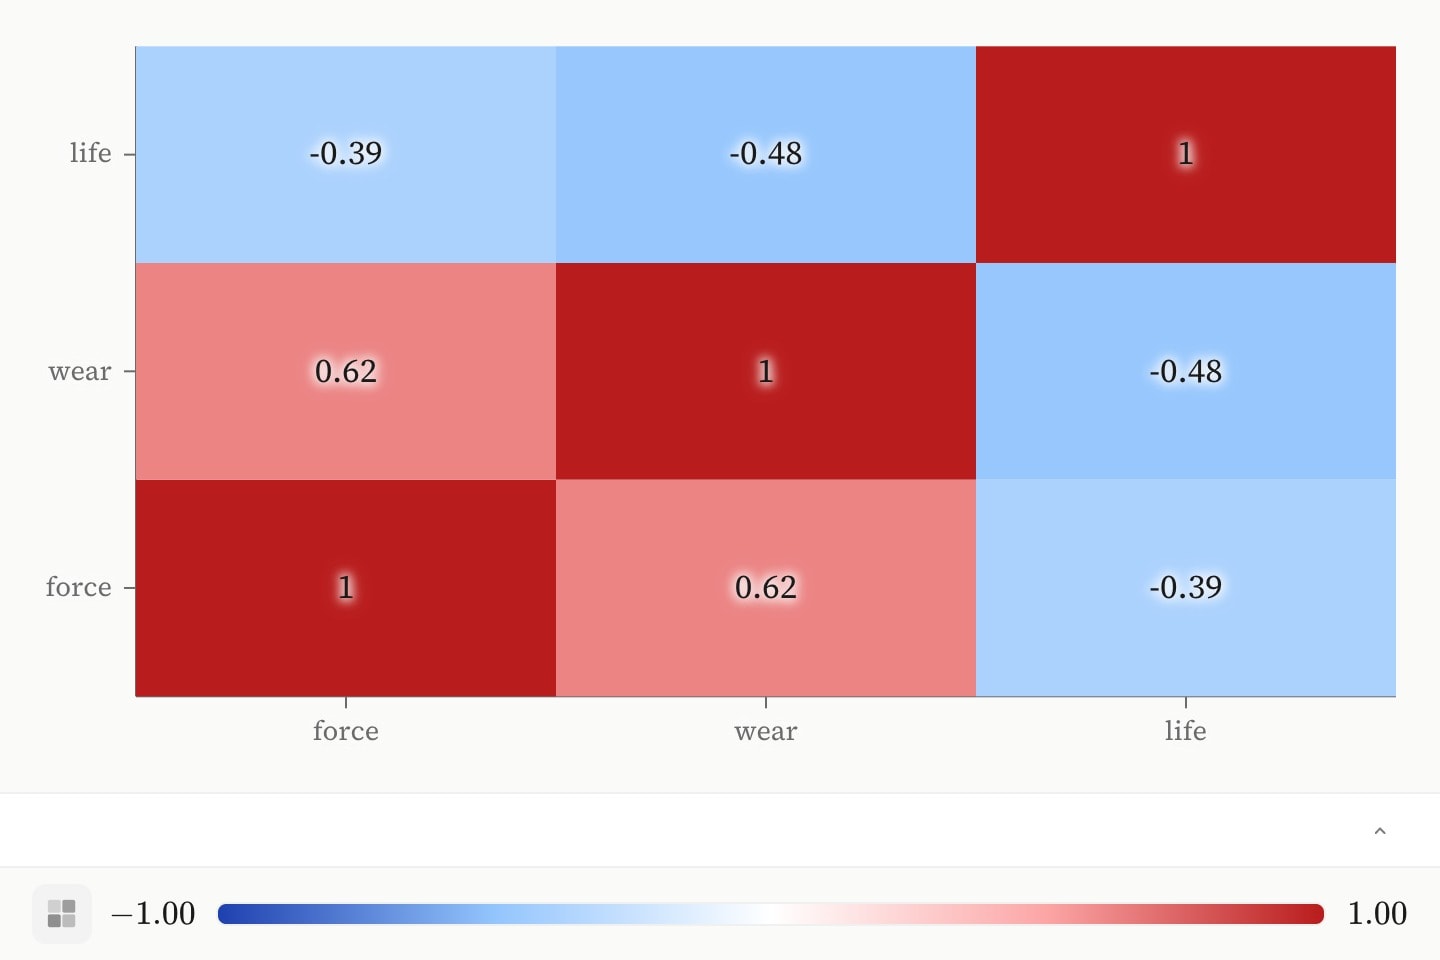
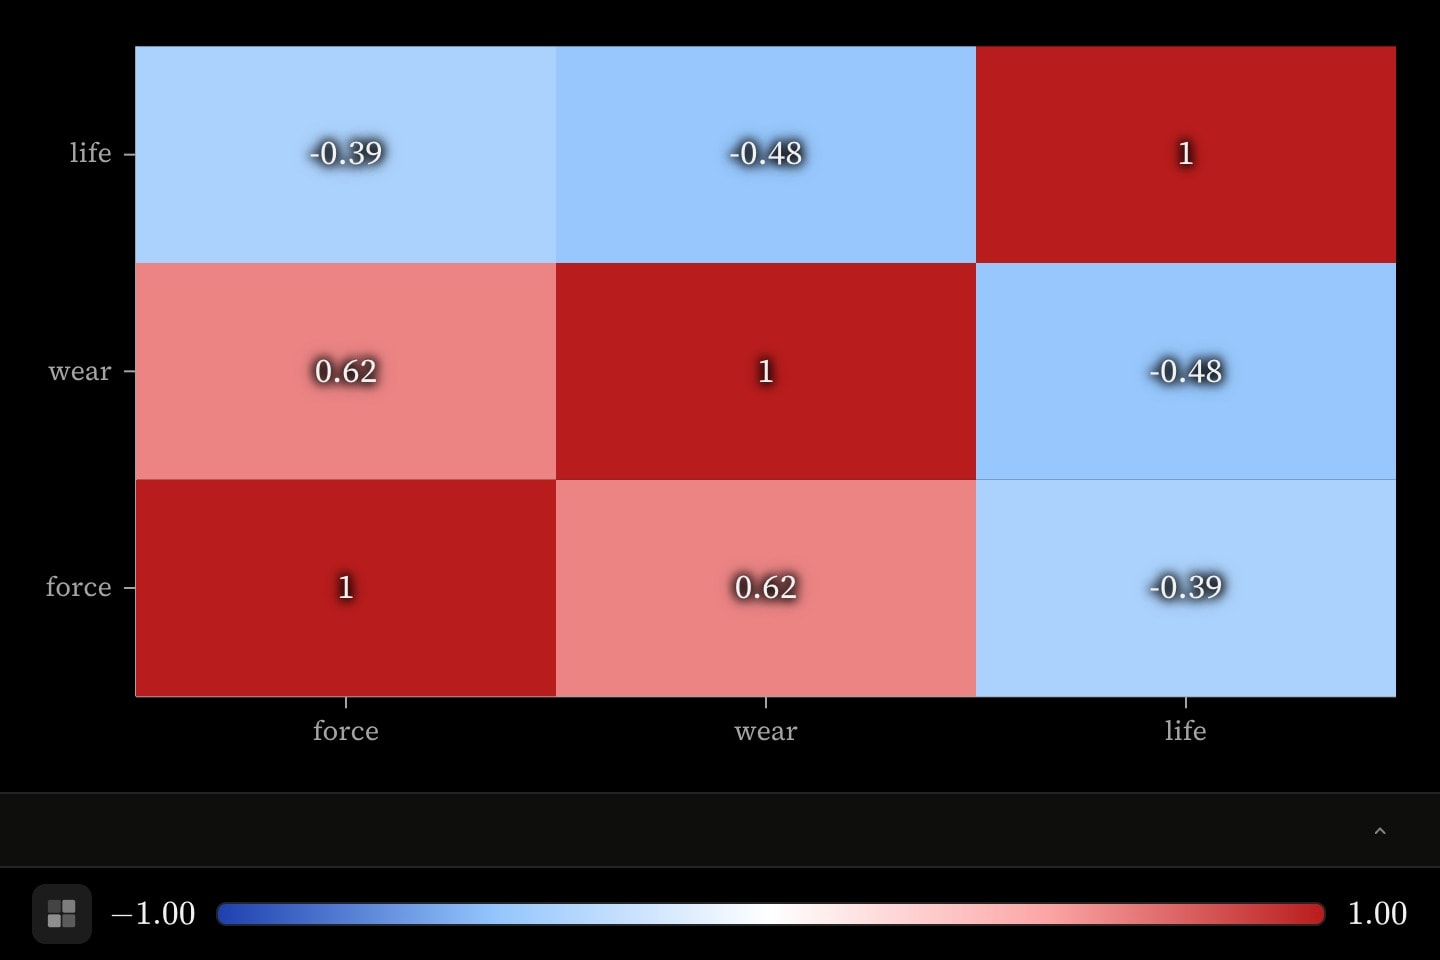
A heatmap is a grid of cells, one value each. x and y say which cell and value says what it holds, three series paired by row — written out, or bound to dataset columns, so a table of a, b, r rows is the whole mark. A correlation matrix is what it is for.
Both axes must be ruled in stops: names, or discrete numbers. A cell is the box an axis rules off, and a continuous axis rules off none — it has a value everywhere, so there is nowhere for one cell to end and the next to begin, and writing x format: numbers beside a heatmap is refused for that reason. You rarely have to say anything: an axis carrying nothing but cells rules itself at their values, so a grid of five loads by four speeds needs no format: line at all. Each cell then fills the band at its stop.
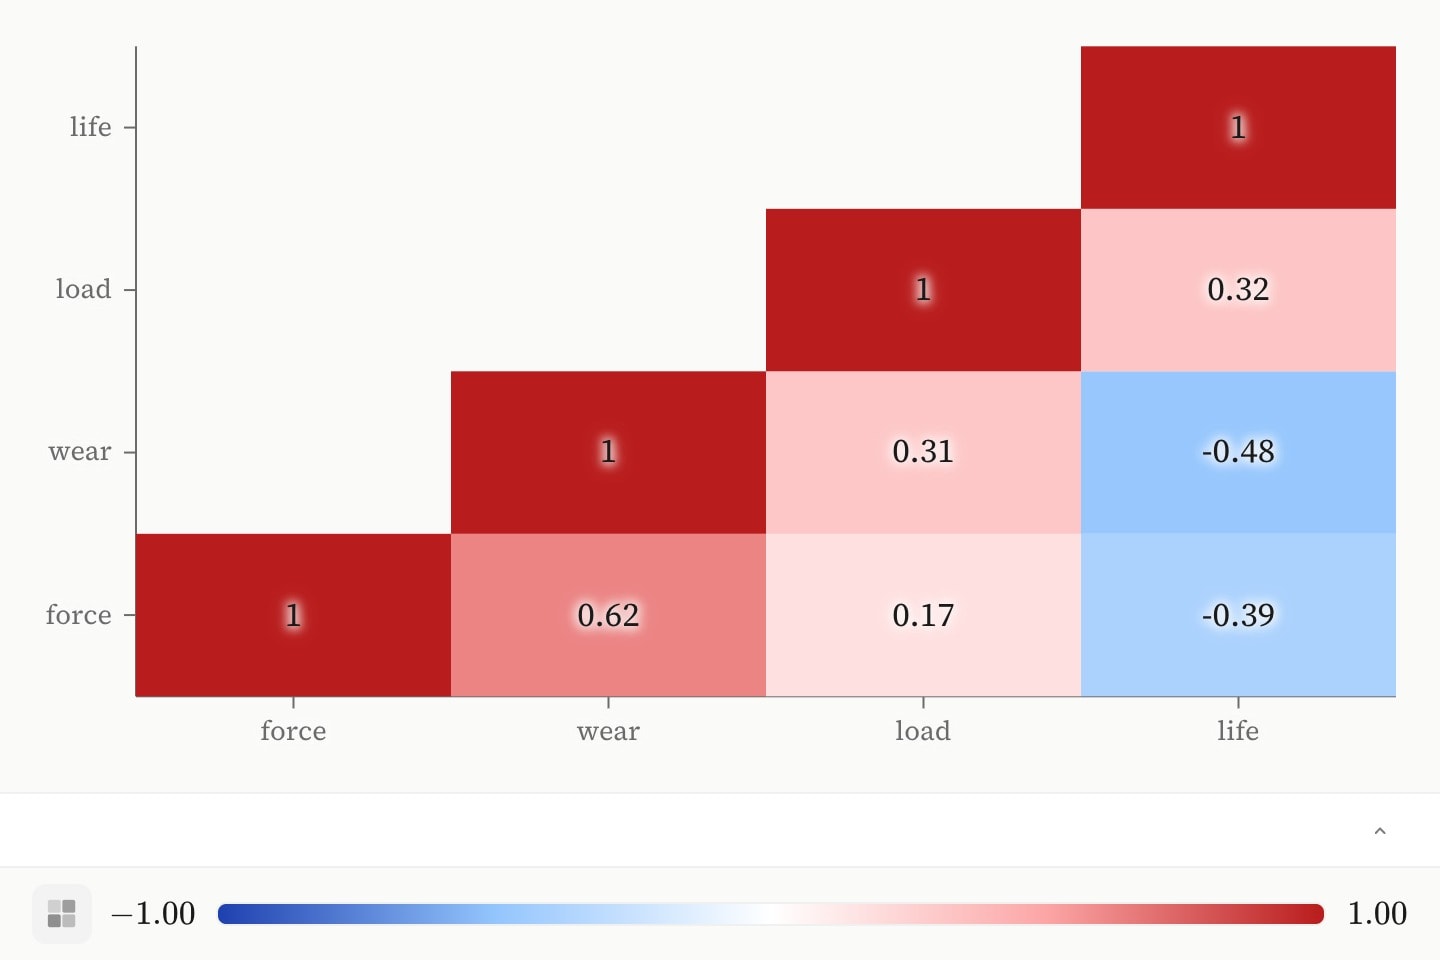
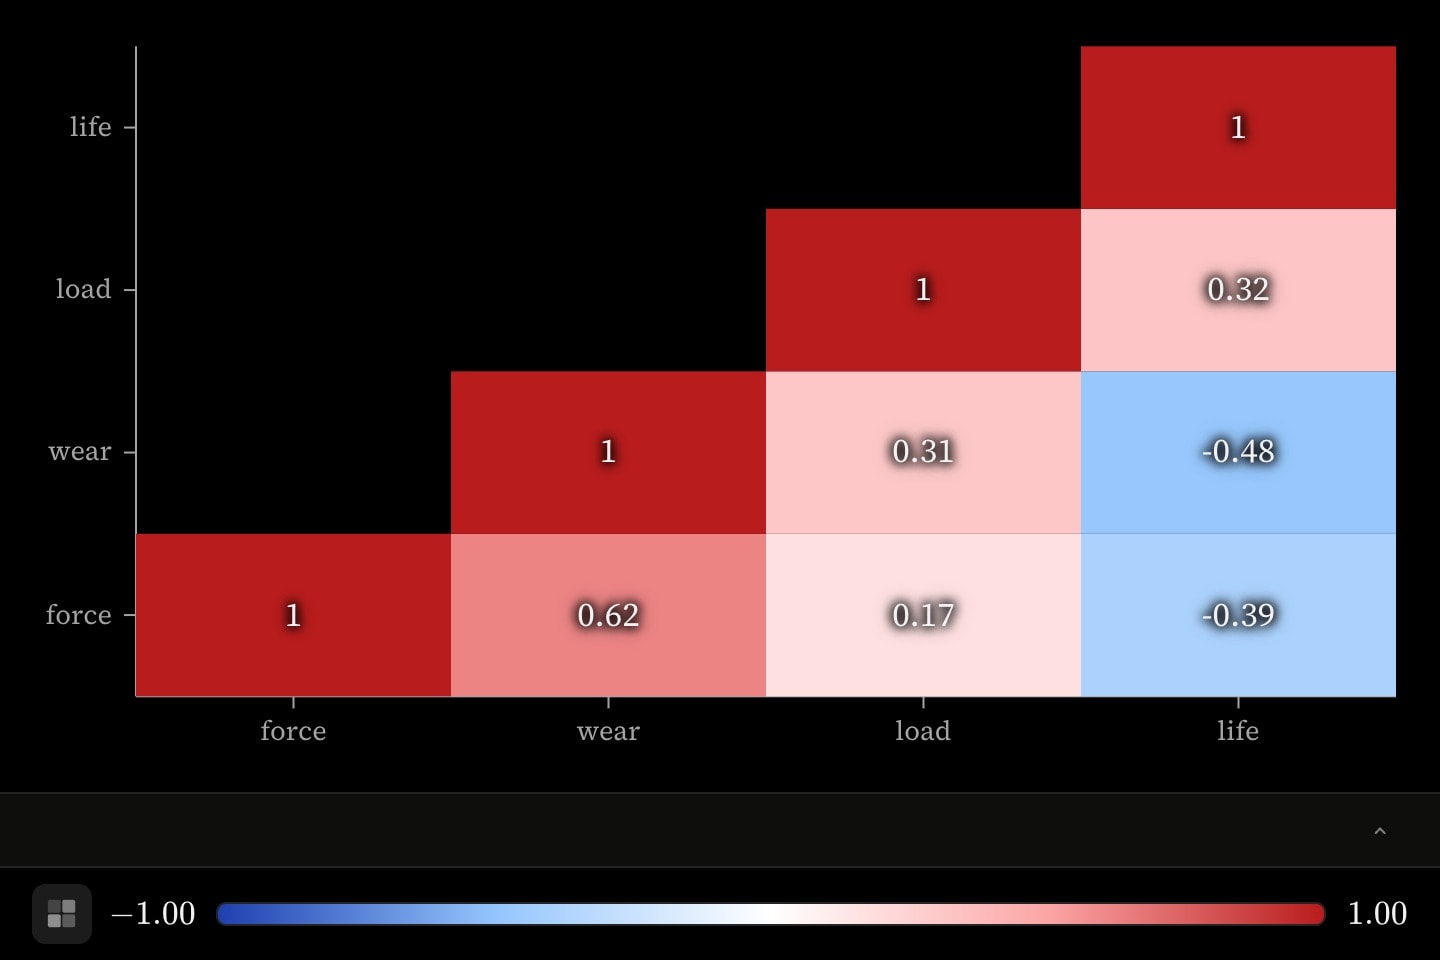
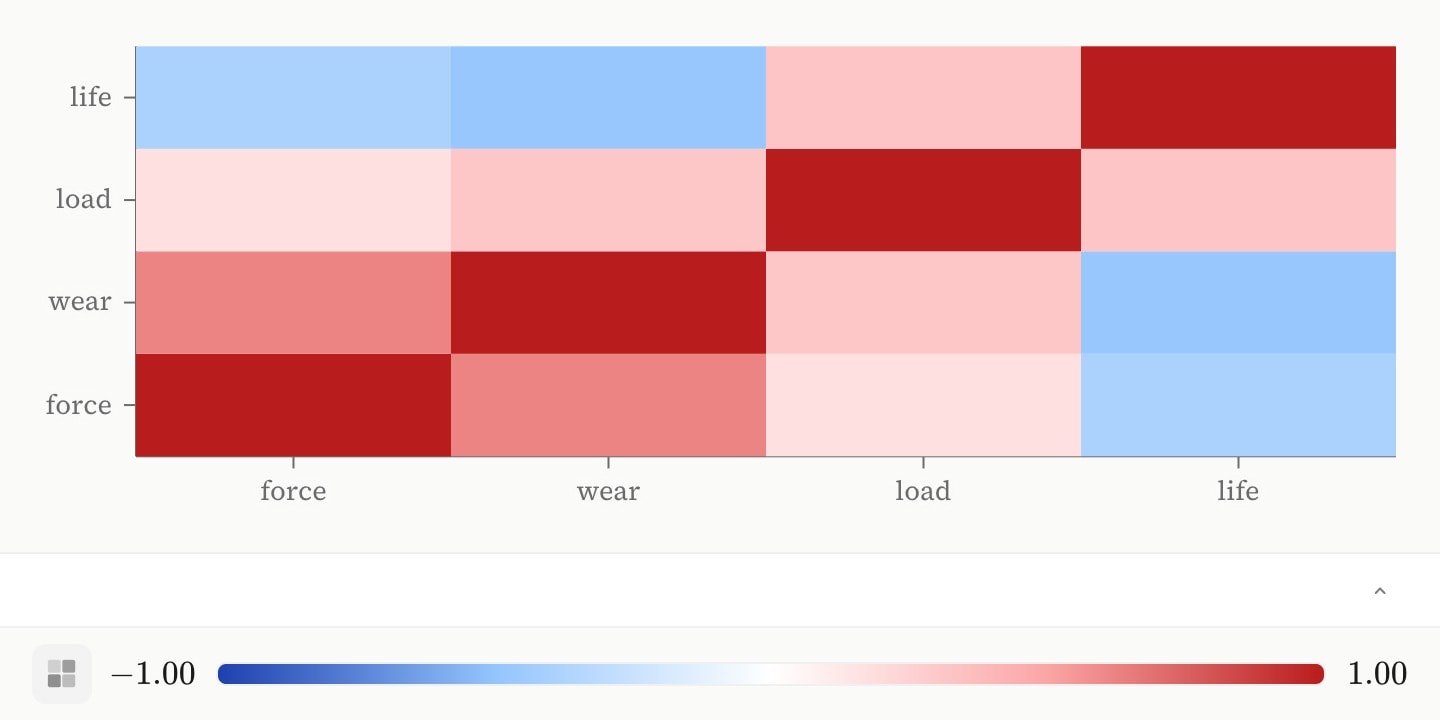
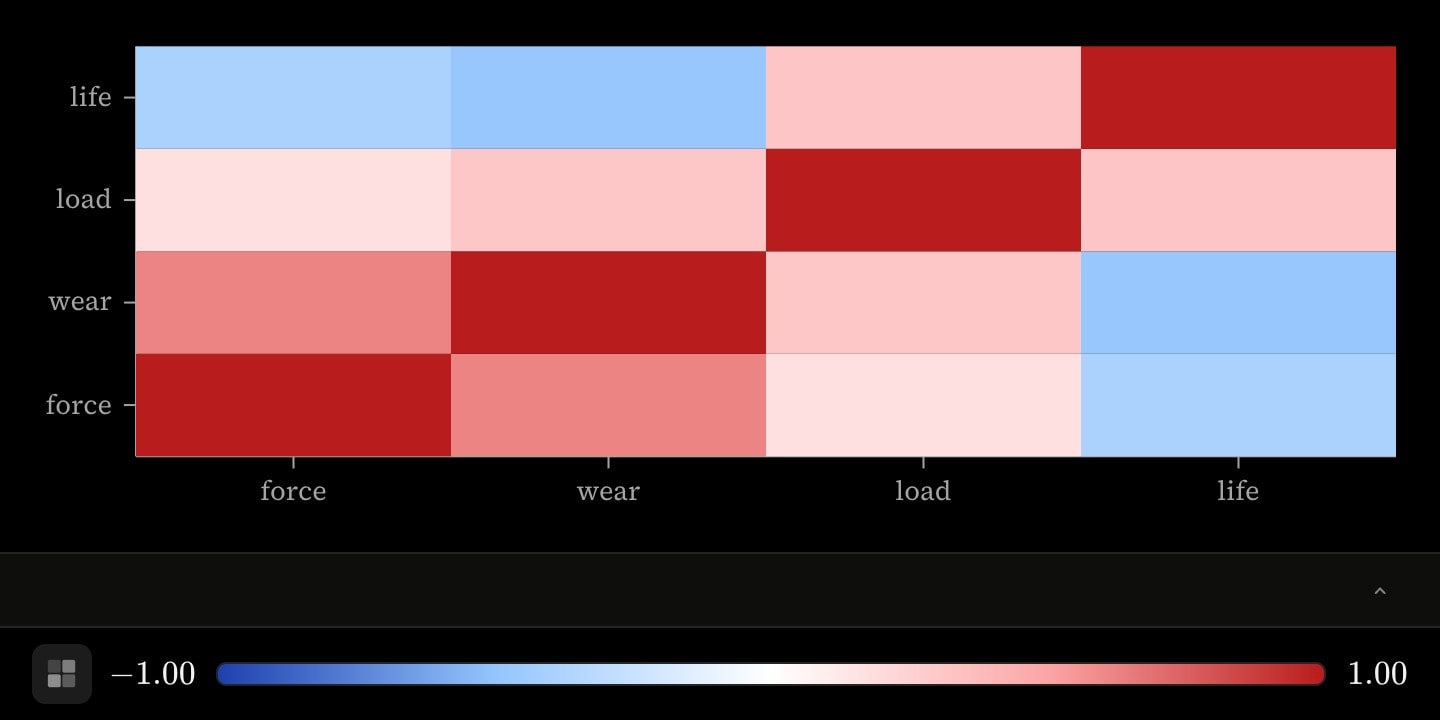
colour takes the same hues and ramps a surface does, and range pins what the ends of the ramp mean — write range: [-1, 1] for correlations, so white falls at no correlation rather than at the middle of this particular sample. show-labels writes each value in its cell, and half: lower drops the mirrored triangle of a symmetric matrix.
The footer carries the key, and prices the cursor against it: moving over the grid slides a dot along the ramp to the value of the cell underneath, exactly as it does over a surface. A cell the data has no row for prices nothing.
canvas.graph{
    heatmap(
        x: force, force, force, force, wear, wear, wear, wear, load, load, load, load, life, life, life, life
        y: force, wear, load, life, force, wear, load, life, force, wear, load, life, force, wear, load, life
        value: 1, 0.62, 0.17, -0.39, 0.62, 1, 0.31, -0.48, 0.17, 0.31, 1, 0.32, -0.39, -0.48, 0.32, 1
        colour: temperature
        range: [-1, 1]
        half: lower
        show-labels: true
    )
}#Attributes
xdiscrete one, written out or a column bound whole (#corr.a). Paired by row with y: and value:.yx: is.valuevaluesCan be written as shorthand: heatmap:valueslicecolourrange: to pin white at zero; any ordinary hue shades its own intensity ramp instead. Both ramps are fixed colours, identical in light and dark mode.blueredorangeyellowtealgreenpinkpurplegreyhex(…)rgb(…)multicolourtemperaturecolormulticolourinvertfalserange[-1, 1] for correlations — so white falls at no correlation rather than at the middle of this sample. Absent, it spans the values given, which re-normalises as a period slides.halffulllowerupperfullgap0show-labelslabelsfalselabelopacity1hiddenhidden: true !cue.to{false}(at: 2) is its reveal.falselocklockedfalsetext-size20layer#Allowed in
#Examples
canvas.graph{
    heatmap(x: #corr.a; y: #corr.b; value: #corr.r; colour: temperature; range: [-1, 1])
}
canvas.graph{
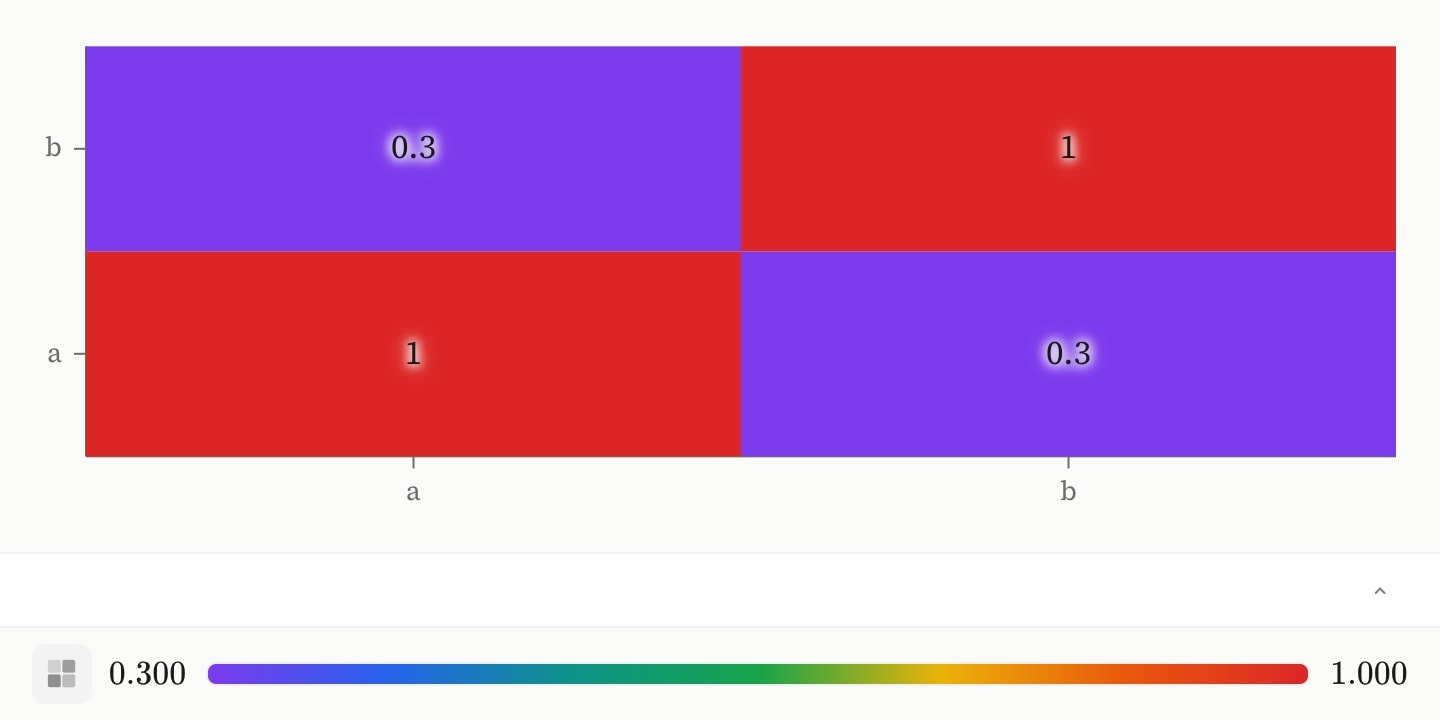
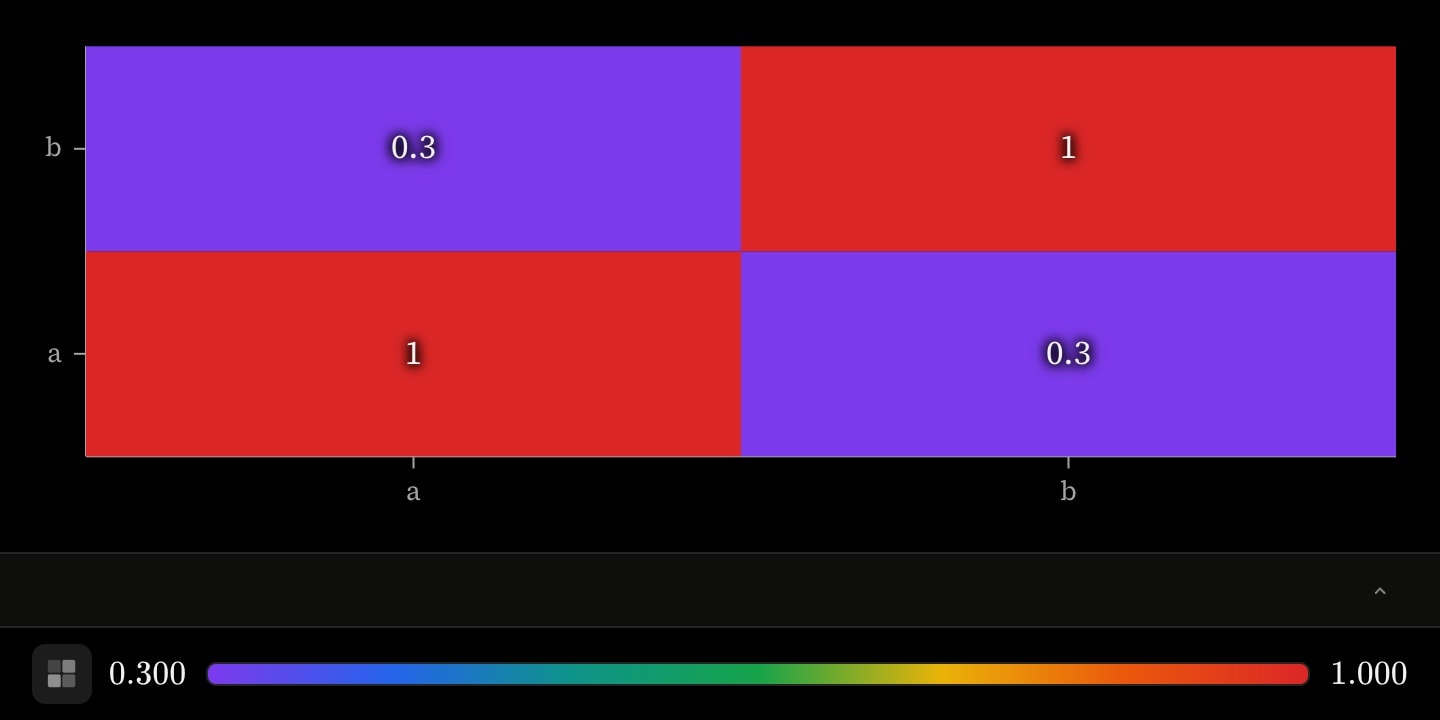
    heatmap(x: a, a, b, b; y: a, b, a, b; value: 1, 0.3, 0.3, 1; show-labels: true)
}