contour
A two-variable expression drawn as its level sets. The expression is in x AND y ((x - 2)^2 + (y - 3)^2), grid-sampled over the visible window and traced where it takes equal values, so panning re-samples the surface and a parameter in the expression moves the level sets live. y is the vertical axis here, not a parameter: only the letters beyond x and y get footer sliders.
contourxyargandpolarplane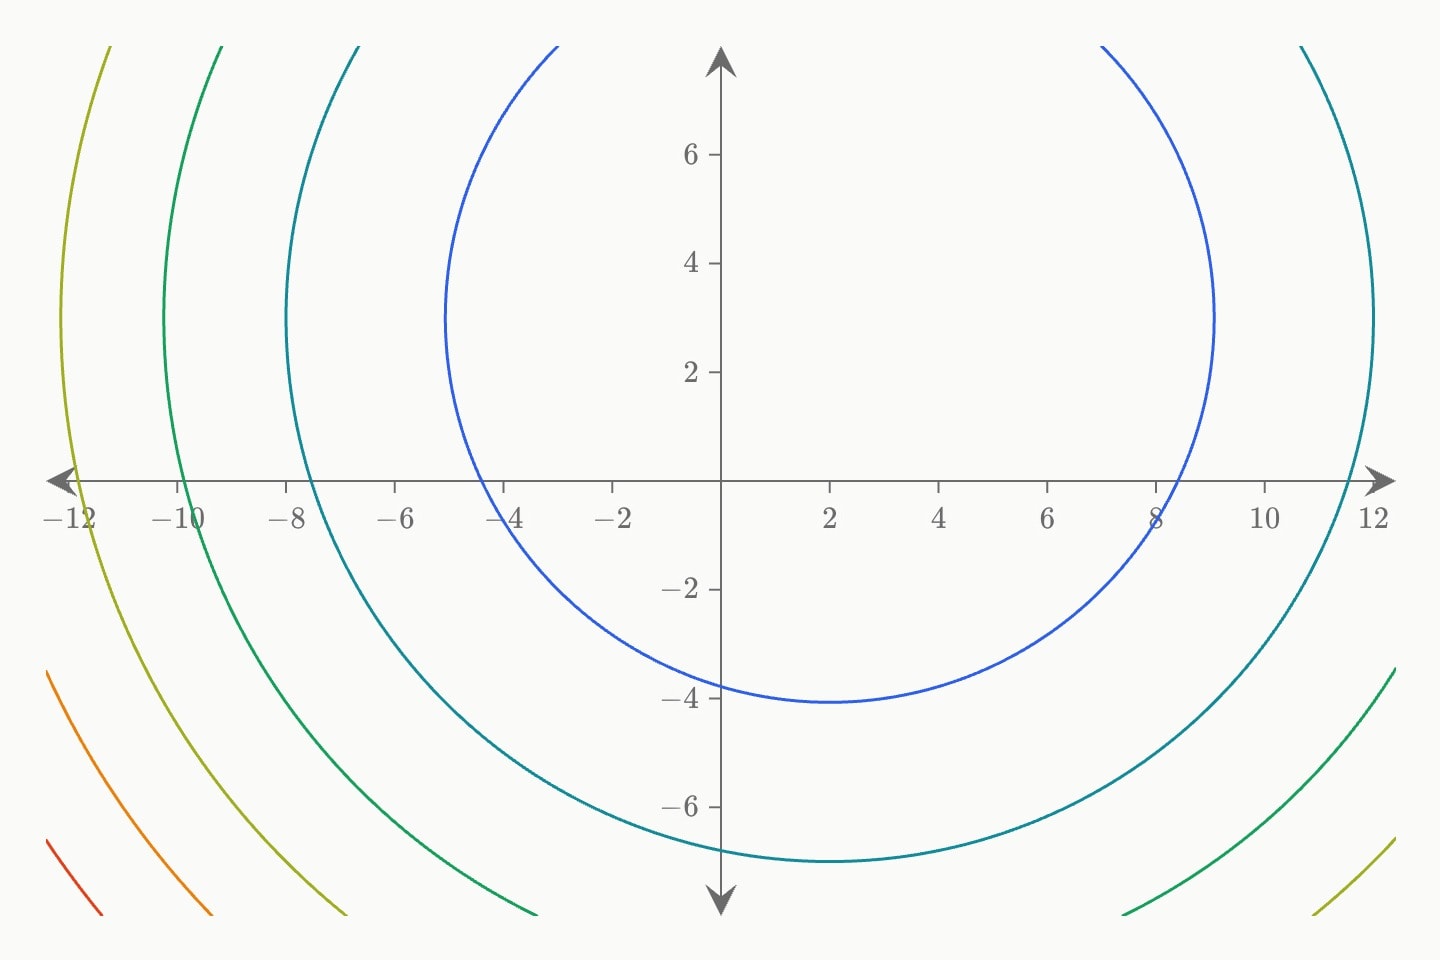
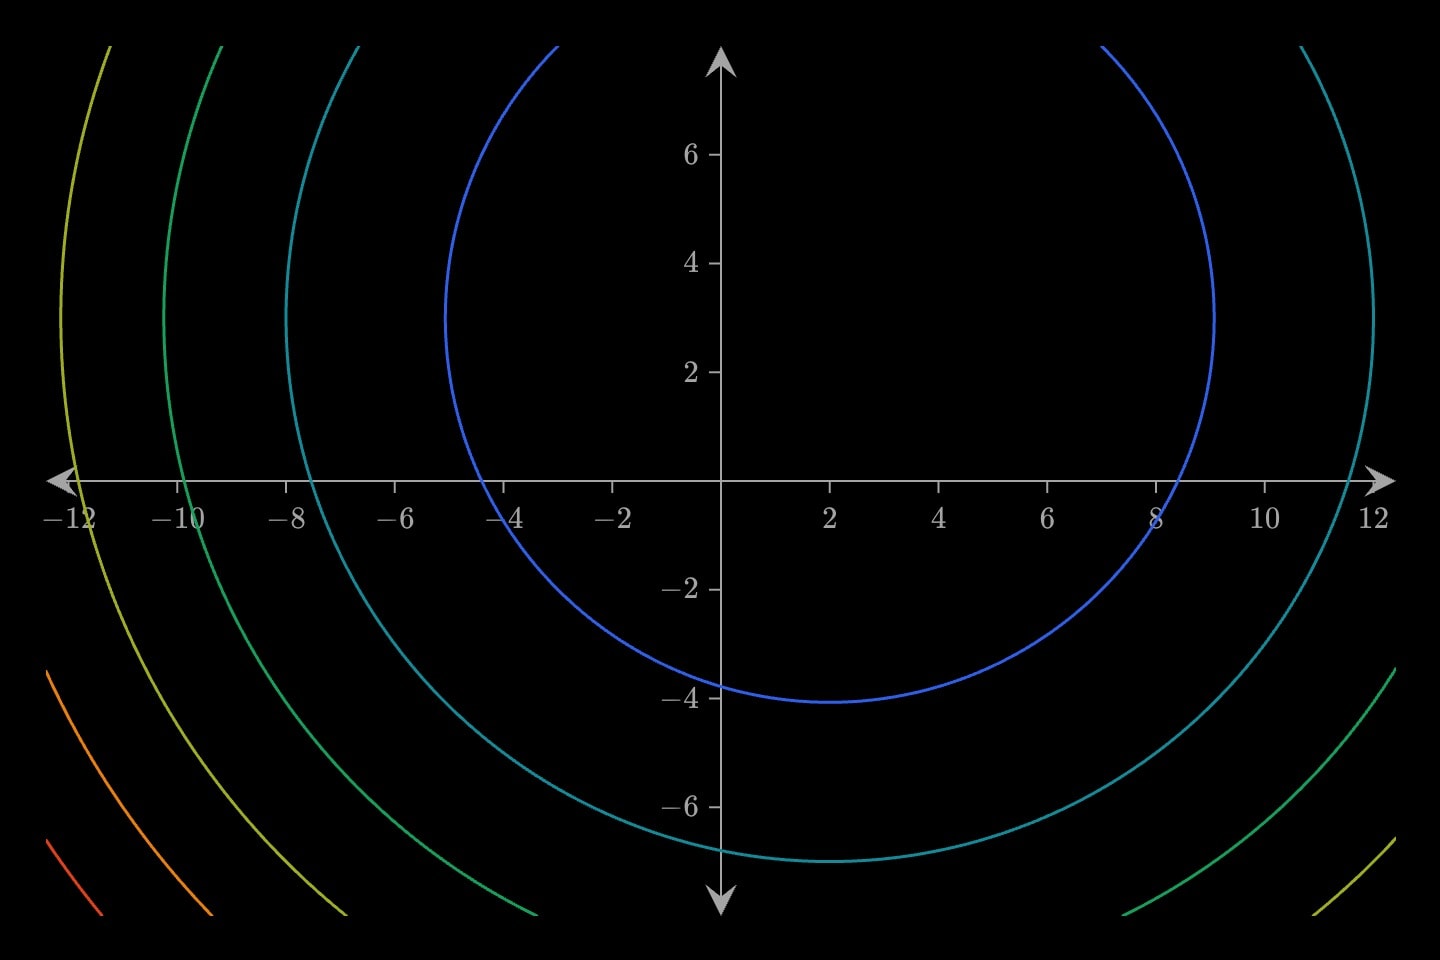
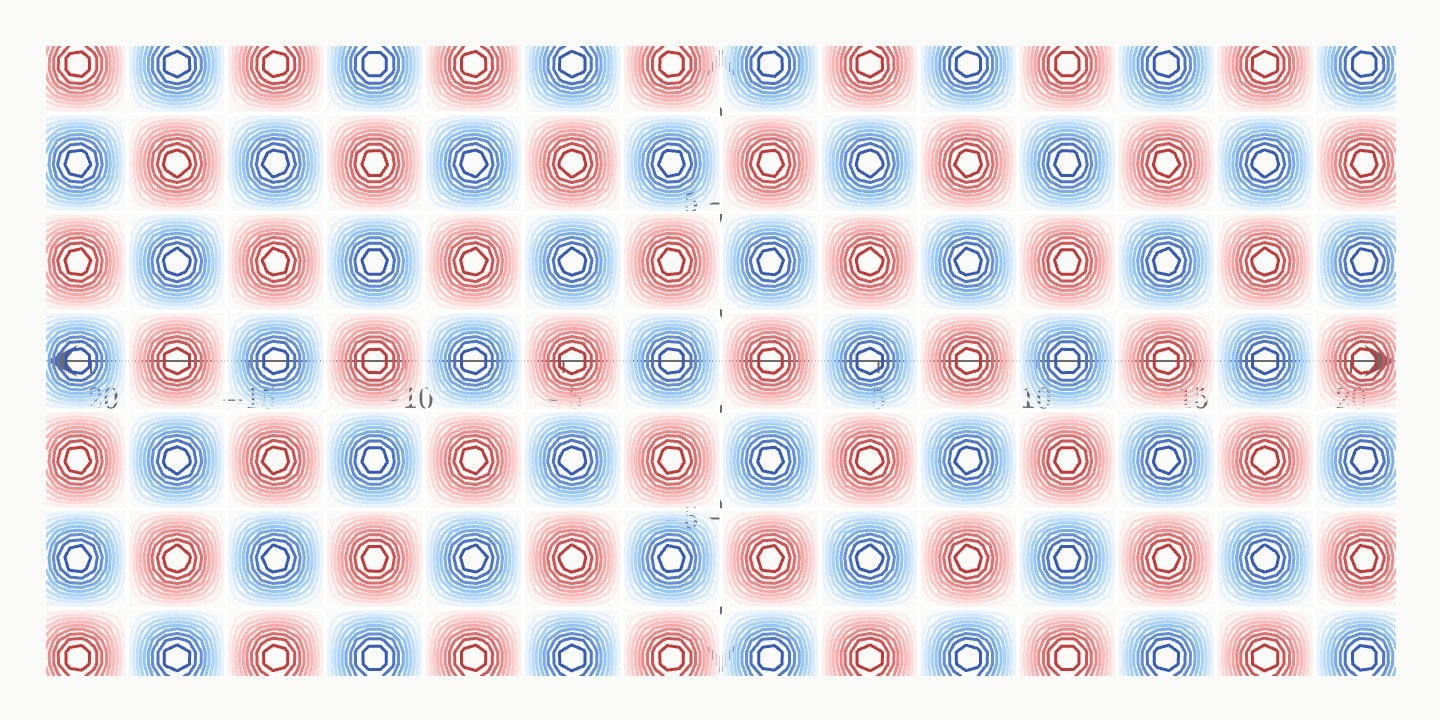
A contour draws the level sets of a function of the plane, either levels: 8 evenly spaced or at: 1, 2, 4 exactly. Its expression may use y alongside x, which only a contour and a surface allow. It takes a colour that is a single hue or a ramp — multicolour (the full spectrum) or temperature (blue through white to red) — and exposes derived min and max over the visible window. A surface of the same expression paints the field its lines are drawn through.
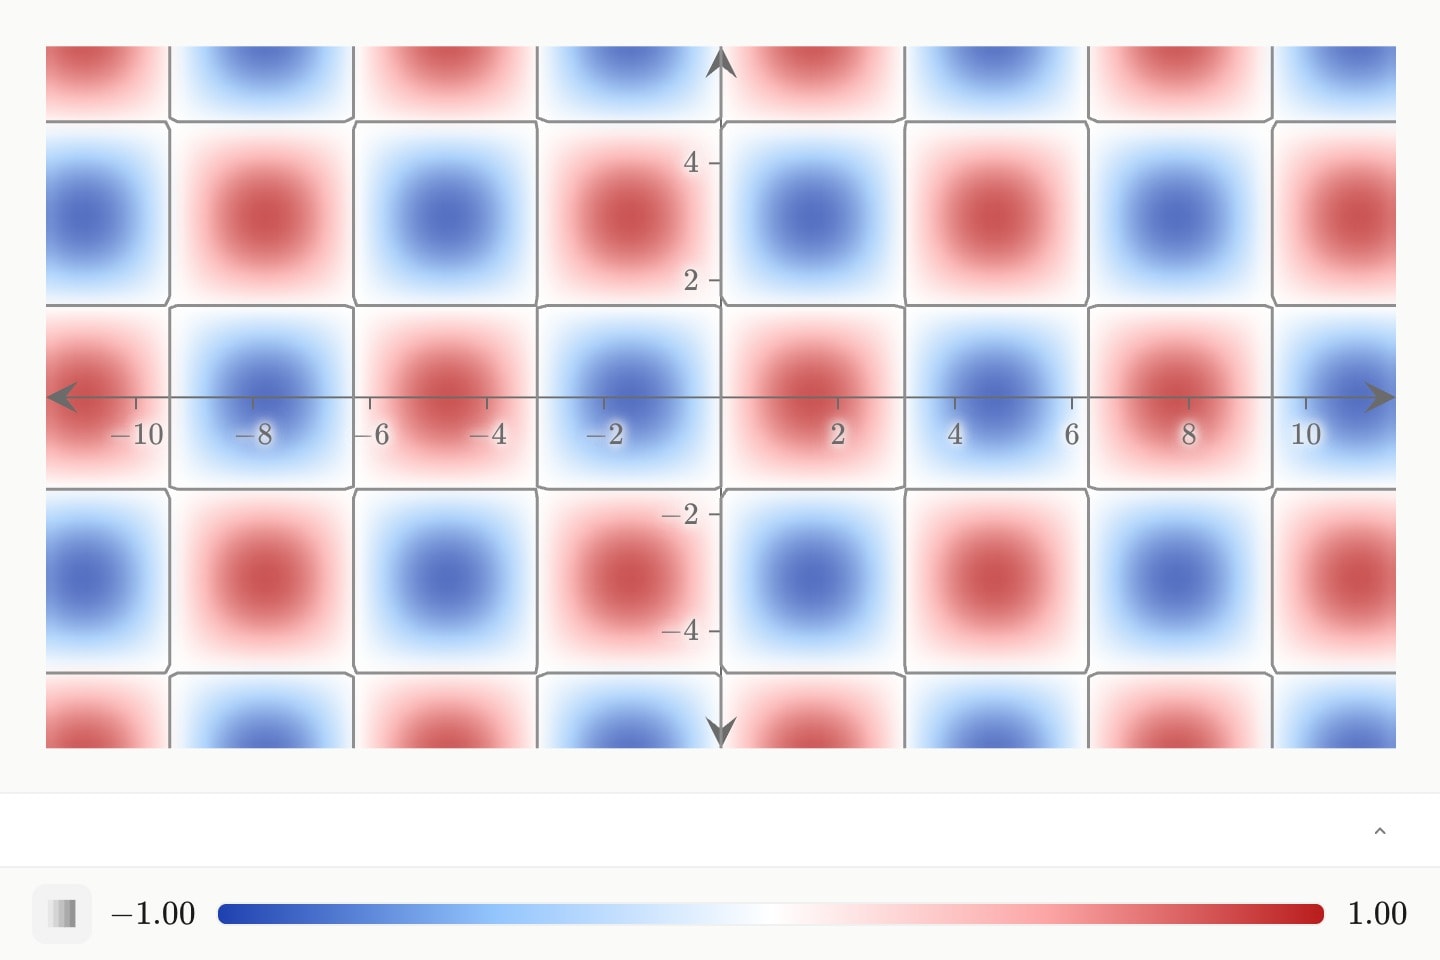
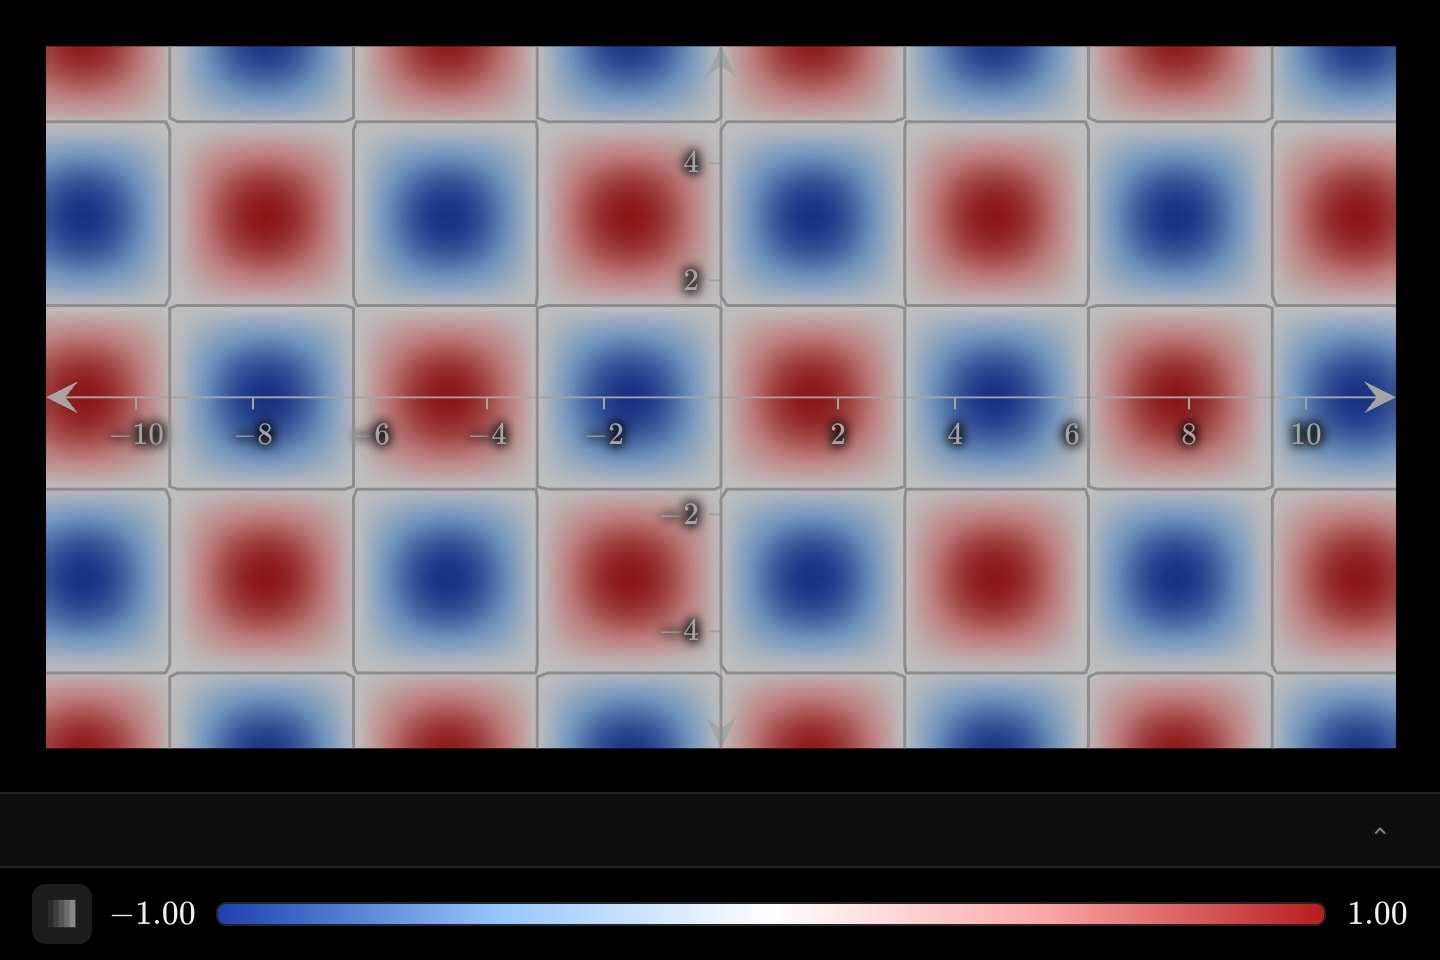
canvas.graph{
    surface(expression: sin(x) * cos(y); colour: temperature)
    contour(expression: sin(x) * cos(y); at: 0; colour: grey)
}#Attributes
expressionexp, f, func, functionCan be written as shorthand: contour:valuelevels12atlevels:, for surfaces whose structure even spacing misrepresents — a quadratic bowl wants 1, 4, 9, 16. Entries are parametised: at: k, 2 * k, 4 * k rides a parameter slider.values, level-valuescolourblueredorangeyellowtealgreenpinkpurplegreyhex(…)rgb(…)multicolourtemperaturecolormulticolourwidth1.5opacity1hiddenhidden: true !cue.to{false}(at: 2) is its reveal.falselocklockedfalselayerz: before the argand plane took that letter for its coordinate.#Derived attributes
Computed while the element renders — read one with #id.name in attribute position or {{#id.name}} in prose, never set.
min{{#id.min}}.max#Allowed in
#Examples
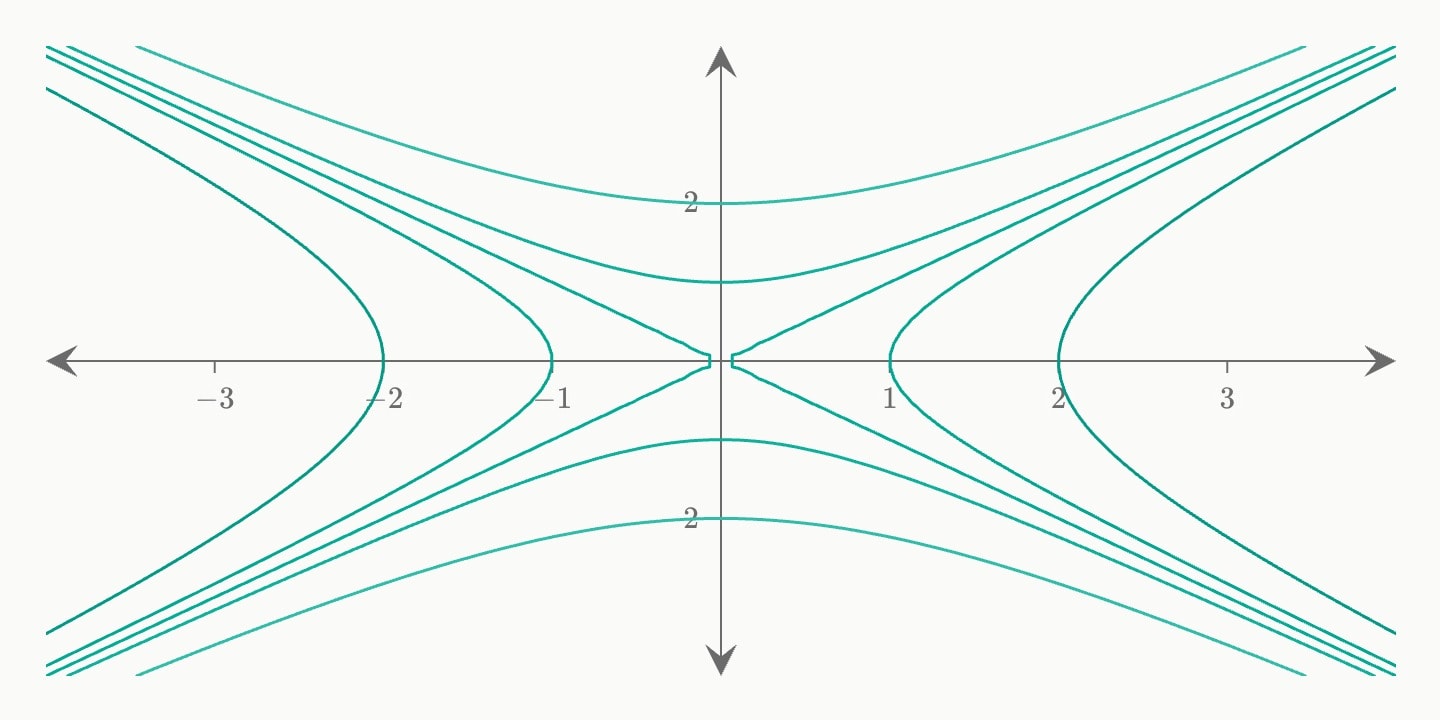
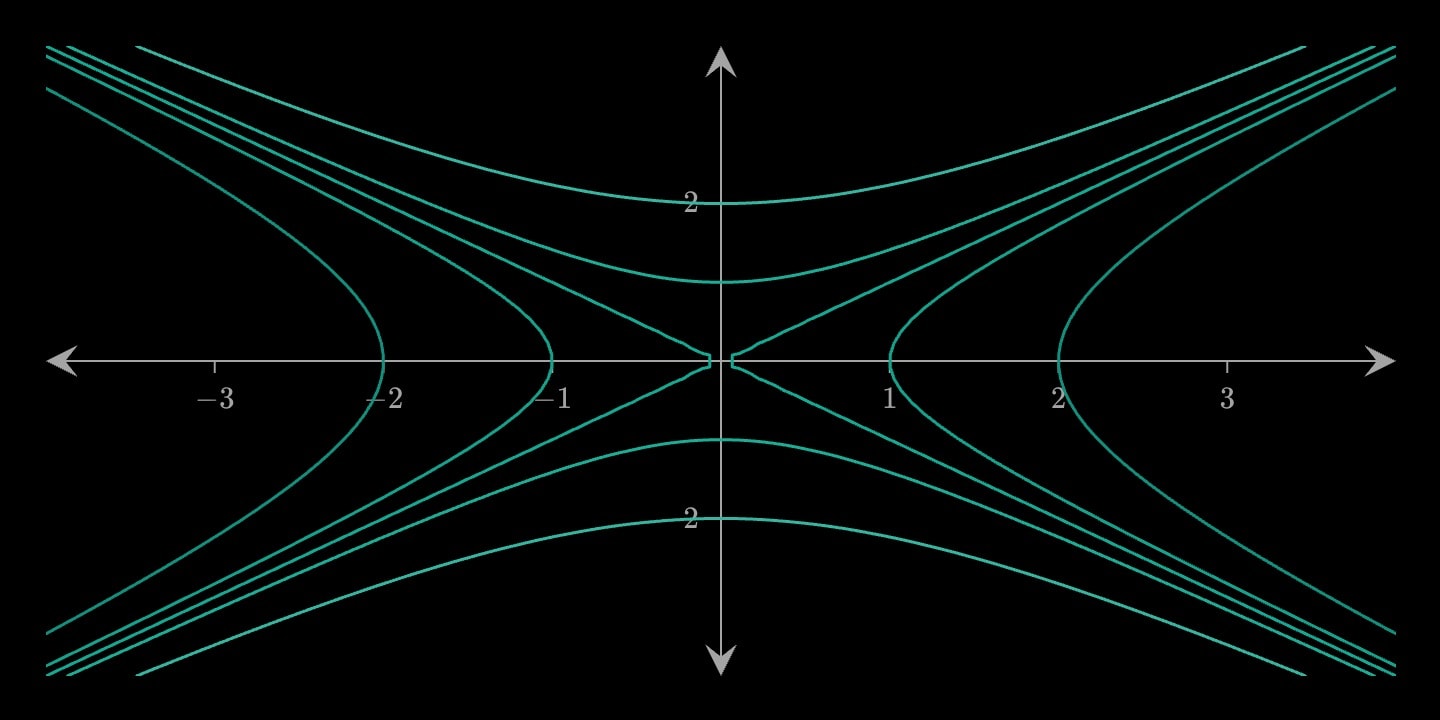
canvas.graph{
    contour(expression: x^2 - y^2; at: -4, -1, 0, 1, 4; colour: teal)
}(
    x-domain: [-4, 4]
    y-domain: [-4, 4]
)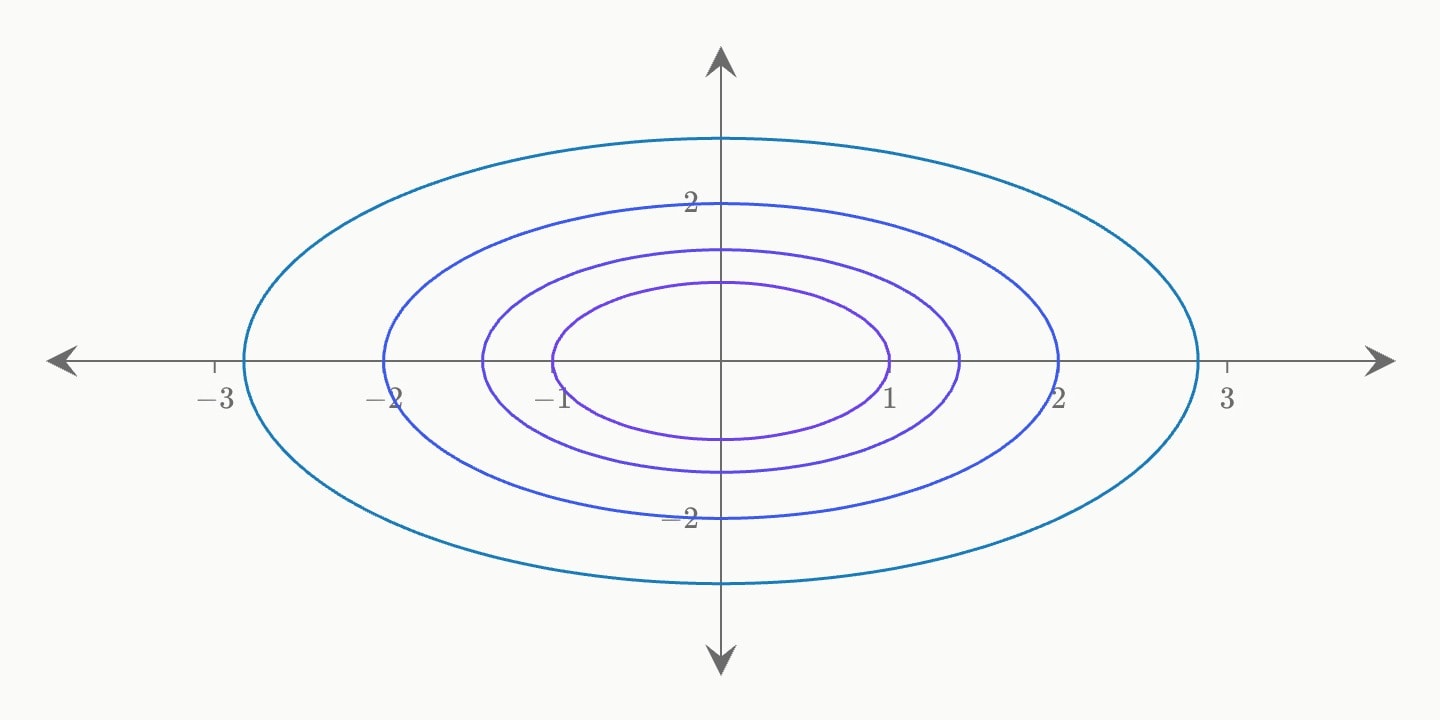
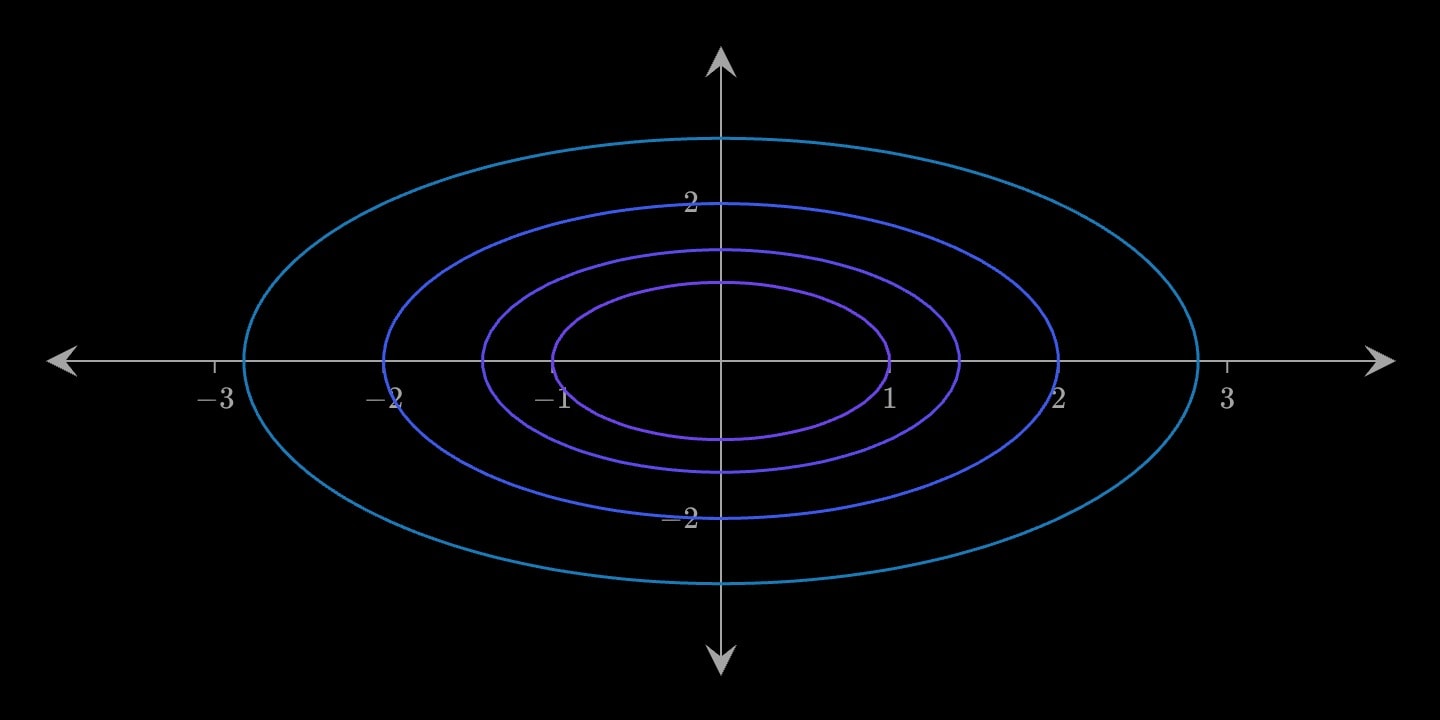
canvas.graph{
    contour(expression: x^2 + y^2; at: 1, 2, 4, 8)
}(
    x-domain: [-4, 4]
    y-domain: [-4, 4]
)
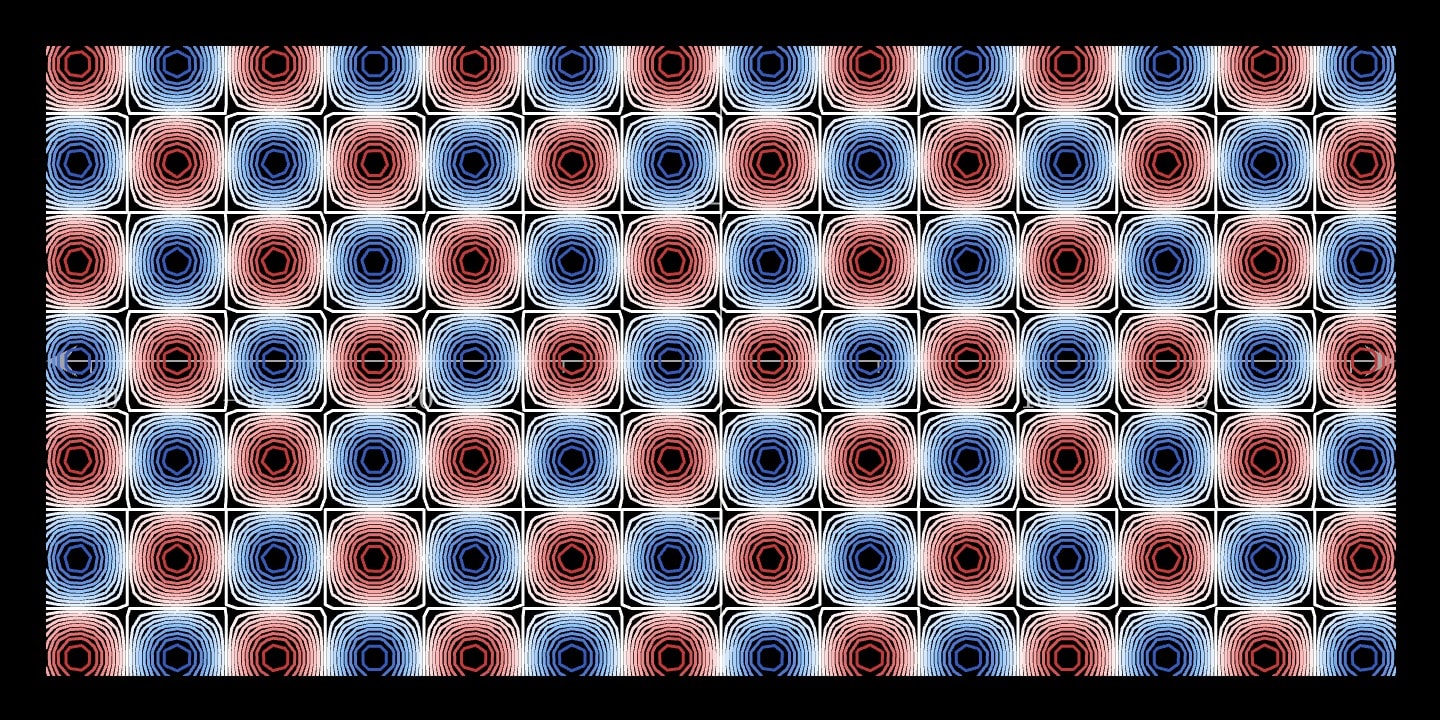
canvas.graph{
    contour(expression: sin(x) * cos(y); levels: 14; colour: temperature)
}