canvas.flowchart
A flowchart environment on the scene's canvas: a flowchart, a tree, a logic circuit, an entity–relationship schema, or an uploaded image annotated with pins. Its image: names an uploaded asset by file name — canvas.flowchart:cell.jpg is an annotated image with no child node needed — and a plain flowchart simply omits it. Boxes are arranged by the environment, layered along direction:, so a flowchart is written as what connects to what; pins carry their own coordinates. Only what a step has on show is arranged, inside a structure taken from the whole environment, so as cues bring boxes in the rest glide to make room and nothing is rearranged. Positions here are fractions of the content frame with the origin at the TOP LEFT and y running DOWN — 0.62, 0.31 is 62% across, 31% from the top, the way a position is read off an image — unlike the graph's y-up mathematics. The frame is a camera: focus: (a point, or #id of a box or pin) and zoom: (a multiplier over the fitted frame) are both animatable with !cue.to, so one keyframe on each glides into a feature as the narrative reaches it.
canvas.flowchart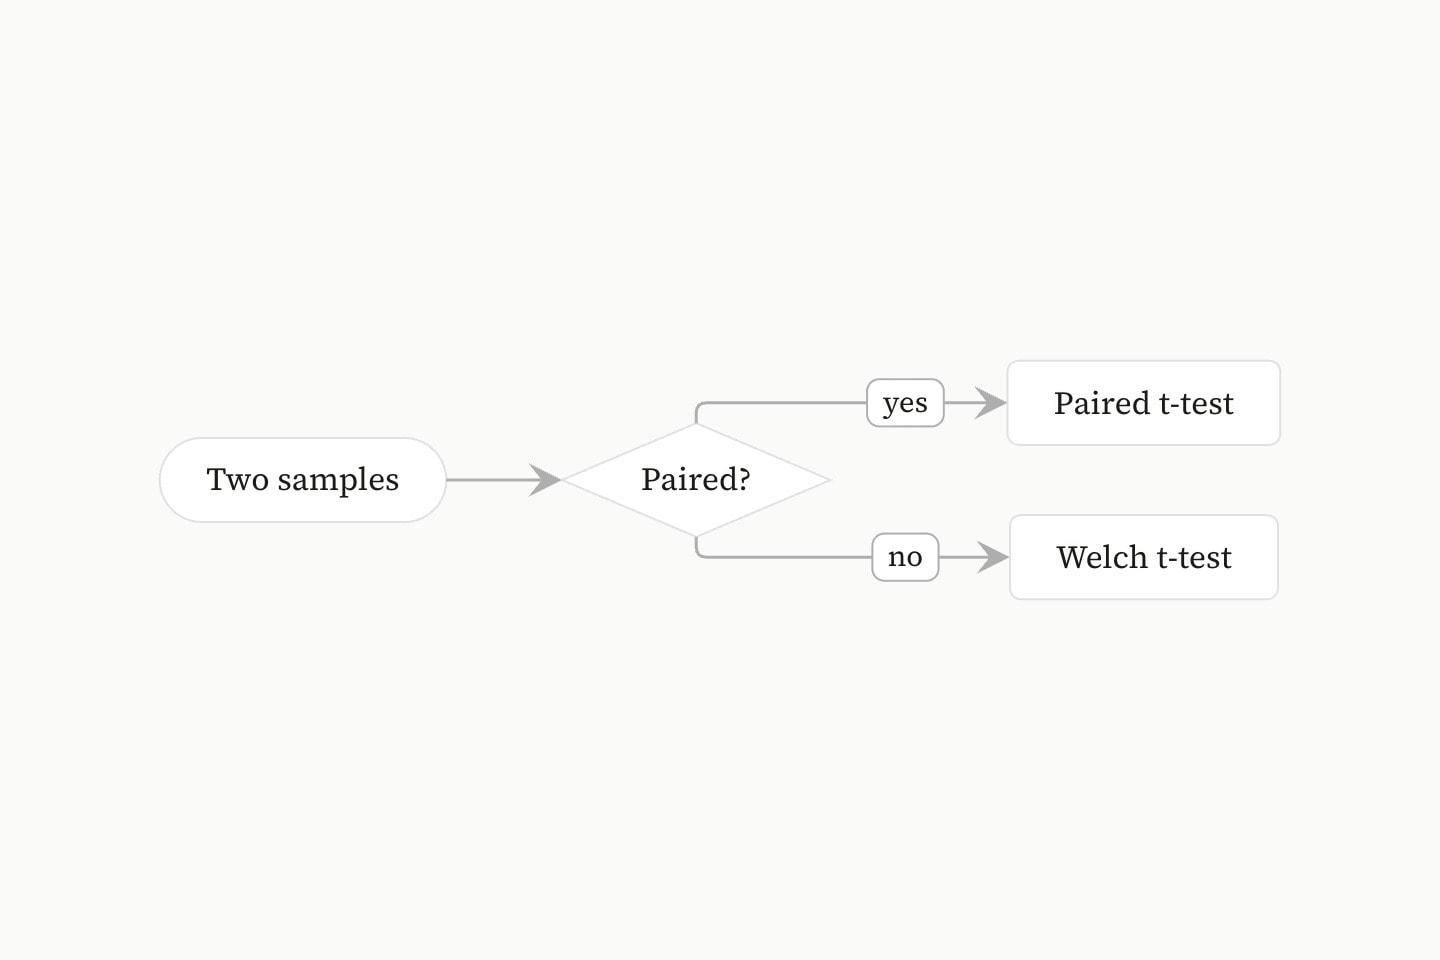
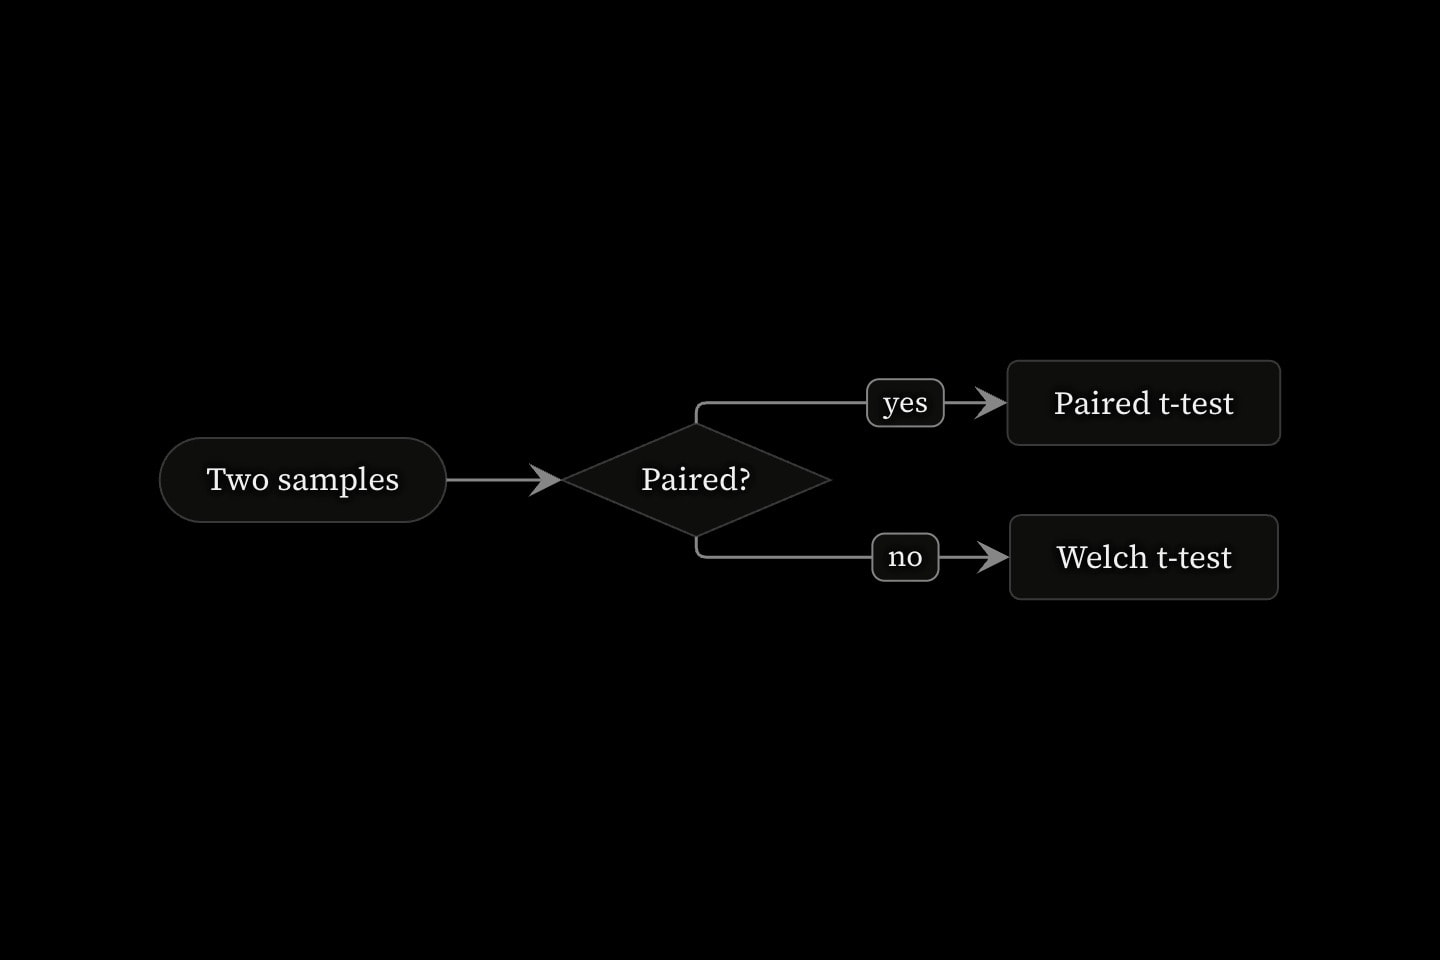
#The flowchart environment
canvas.flowchart holds the pictures that are neither plots nor maps: an uploaded image annotated with pins, a flowchart, a simple tree. Its implicit attribute is image, an uploaded asset named by its file name — canvas.flowchart:cell.jpg is an annotated image with no child node needed — and a plain flowchart simply omits it.
The environment compiles whether or not the asset is there: an image: naming nothing renders a message in place of the picture, saying which file name it looked for. An annotated image is therefore written and compiled against the coordinates first, and the picture uploaded after.
Positions are fractions of the content frame with the origin at the top left and y running down: 0.62, 0.31 is 62% across and 31% from the top, the way a position is read off an image. This is deliberately not the graph's y-up mathematics — a free-form coordinate drawing belongs in canvas.graph with !show background.
#Images and pins
A pin is a labelled point on the image: a dot on the feature, a short hairline leader, the label beside it. at: is its implicit attribute; side: places the label, defaulting to whichever side has room. Cues gate pins exactly as they gate graph marks, so annotations arrive with the narrative.
canvas.flowchart:cell-micrograph.jpg{
    pin#nucleus(at: 0.62, 0.31; label: Nucleus)

    cue{
        pin(at: 0.28, 0.55; label: Mitochondrion)
    }(
        in: 1
    )
}#Boxes and arrows
A flowchart is written as what connects to what, never as coordinates. box declares the things and arrow the relations between them — endpoints are #ids of boxes or pins in the same environment — and the environment arranges the result in layers along direction: — down by default, up, right or left. A tree is the same arrangement with the arrows all pointing one way. Chains that share no arrow are arranged apart, each ranked on its own, and stand side by side across the flow — columns under down, rows under right — so a wide box in one never moves a box in the other.
The arrows run through the space between the layers, never across a box and never along one another. Each leaves and arrives at the middle of a face: one arrow at its centre, several evenly spaced about it in the order of where they are going. The boxes are placed so those points line up, and an arrow whose two ends line up is a straight line; one whose ends cannot turns once, cleanly, on a track of its own. An arrow that skips layers runs straight down the gap beside the layers it passes. Every arrow leaves the front of its box and lands on the back of the next, whichever way it runs, so an arrow back up the flow loops round: out of the later box, up beside the layers between, and down into the earlier box from behind.
An arrow's label: is set in a small chip on its own straight run, near where it leaves, so the words stand clear of every line. Where arrows leave a face too close together for that, the chip sits just beside its line.
A chart longer than the environment has room for wraps rather than shrinking, so a box keeps the size its text needs. Plain, it snakes: the next line reads back the other way, and the arrows across the fold drop past the ends of both lines and turn up into the next. A strictly- direction — strictly-down, strictly-up, strictly-right, strictly-left — keeps every line reading the one way: each starts again at the beginning beside the last, the way lines of text do, and the arrows across a fold are carried back along the gap between the lines.
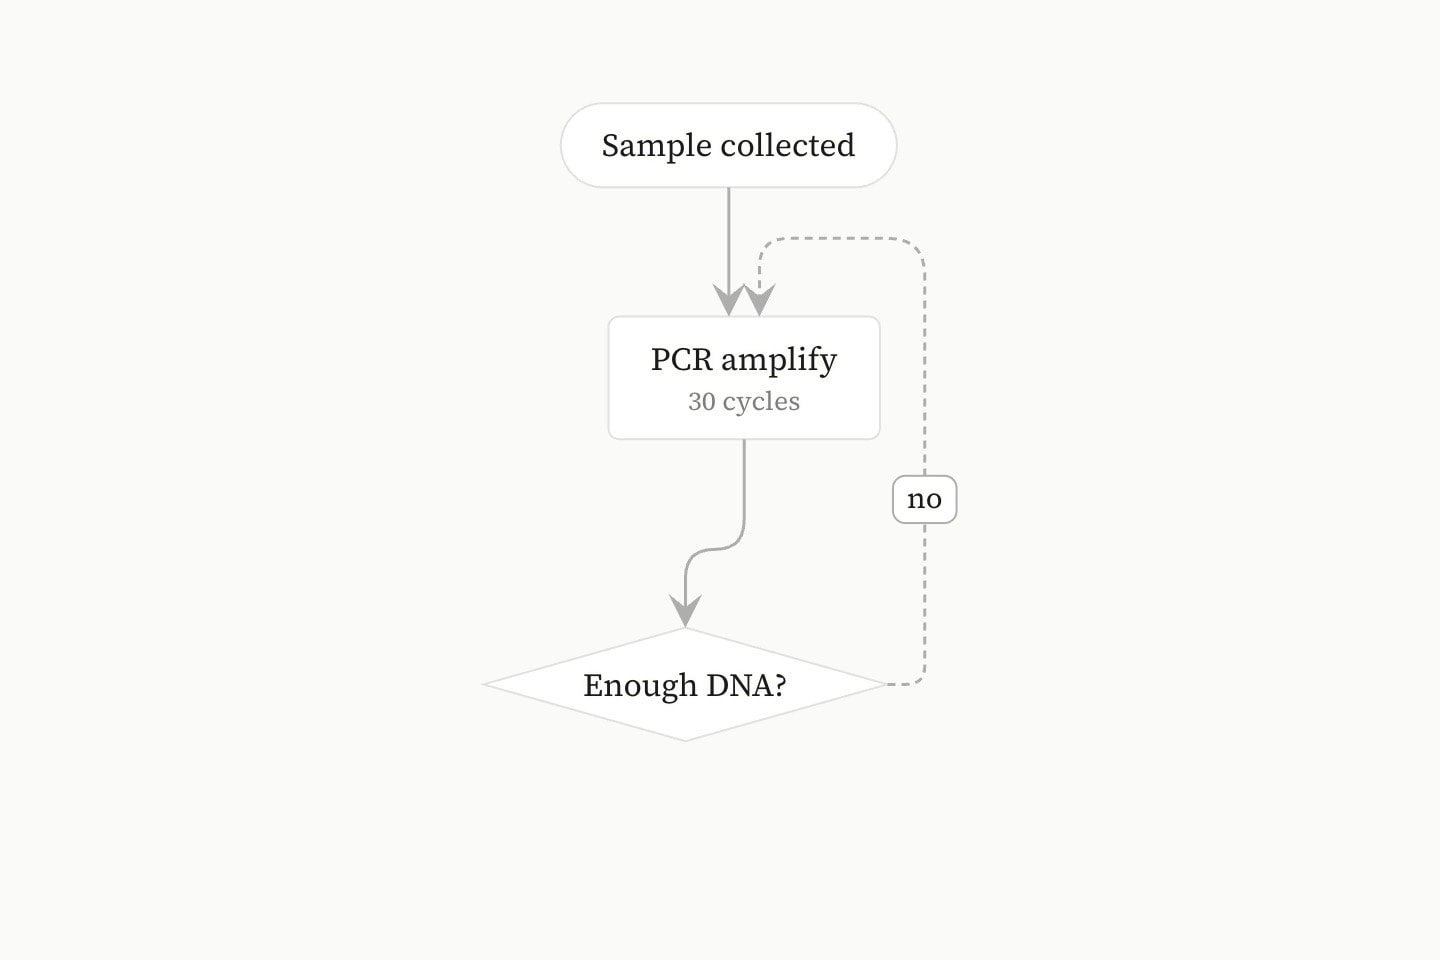
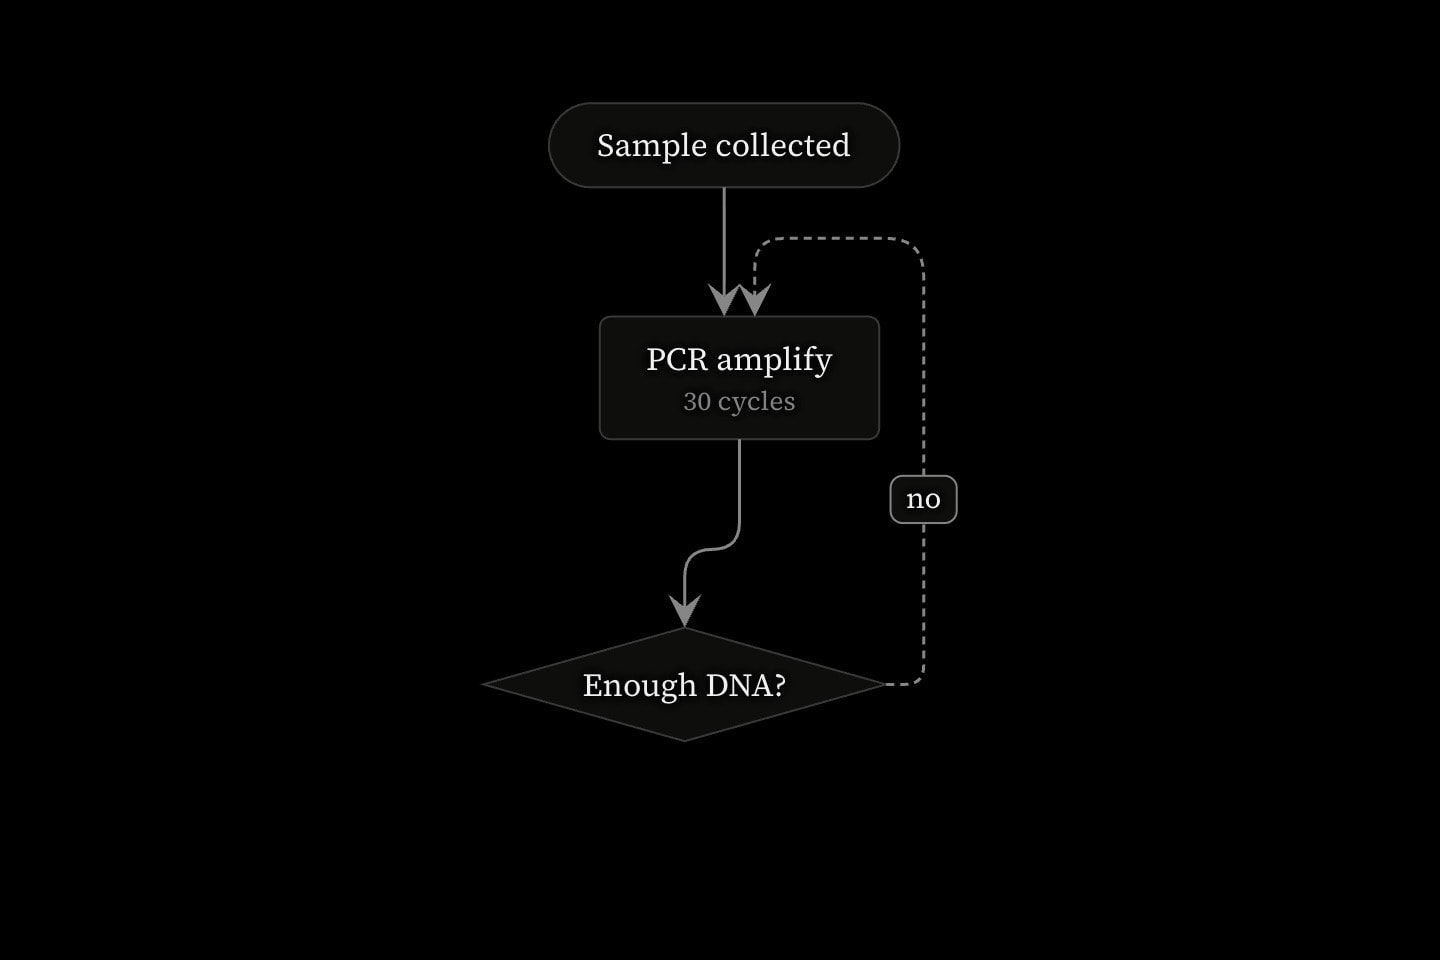
canvas.flowchart{
    box#sample:terminal{Sample collected}
    box#pcr{
        PCR amplify
        30 cycles
    }
    box#check:decision{Enough DNA?}

    arrow(from: #sample; to: #pcr)
    arrow(from: #pcr; to: #check)
    arrow(from: #check; to: #pcr; label: no; dashed)
}(
    direction: down
)hidden: at the step, takes no room; when a cue brings one in, the rest glide to make room for it, and the newcomer fades in once they have. cue.draw strokes an arrow in along its own length, and draws several boxes and arrows along the flow, each a little after the one before; a dashed: arrow fades instead, since a dash pattern and the draw reveal cannot share one stroke.#Shapes
shape: carries the flowchart conventions a reader already knows: box (the default rounded rectangle), decision (the diamond), terminal (the pill) and ellipse. It is the implicit attribute, so box#check:decision{Enough DNA?} reads as the diamond it draws. A box's text is its body, rich inline — maths, bold and {{…}} all work — and the body keeps its source lines: the first is the label, every further line a smaller muted line beneath it. Text wider than the widest box wraps rather than spilling.
Logic circuits take the schematic symbols: and, or, not, nand, nor, xor, xnor, mux and alu, turned to the flow. A gate is directed: every arrow into it lands on an input port on its back, spaced to the number of arrows arriving, and every arrow out leaves its one output, so a gate feeding three others fans out from a single point the way a wire does. A loop back into a gate, as in a latch, goes round it and still lands on an input. A gate usually needs no words, so its body is empty, box#g:and{}; words given are set inside the symbol, as box#u:alu{ALU}.
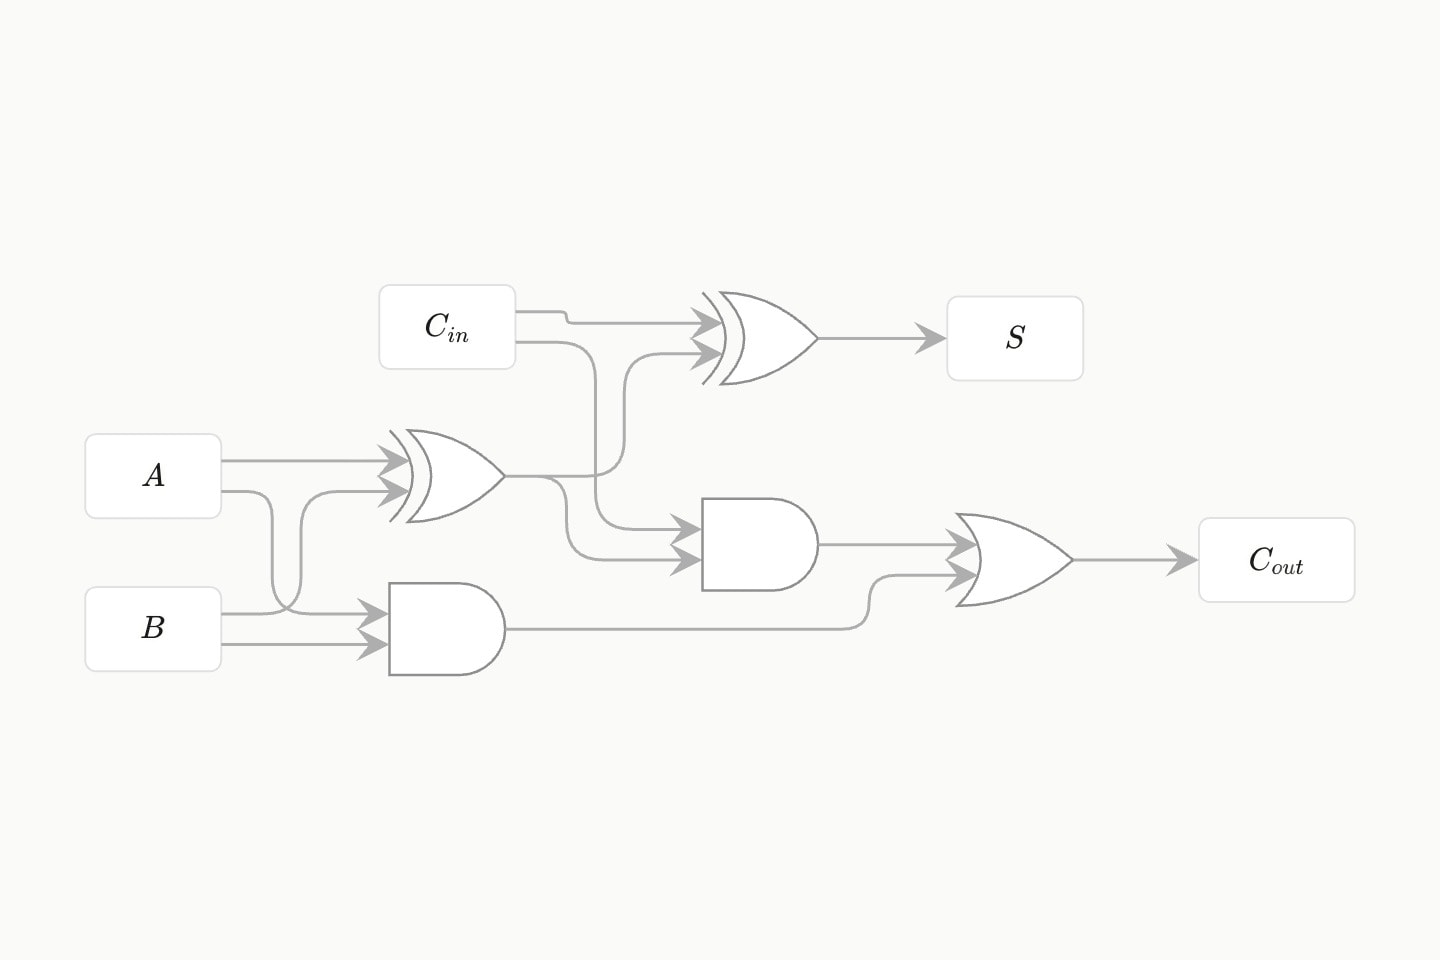
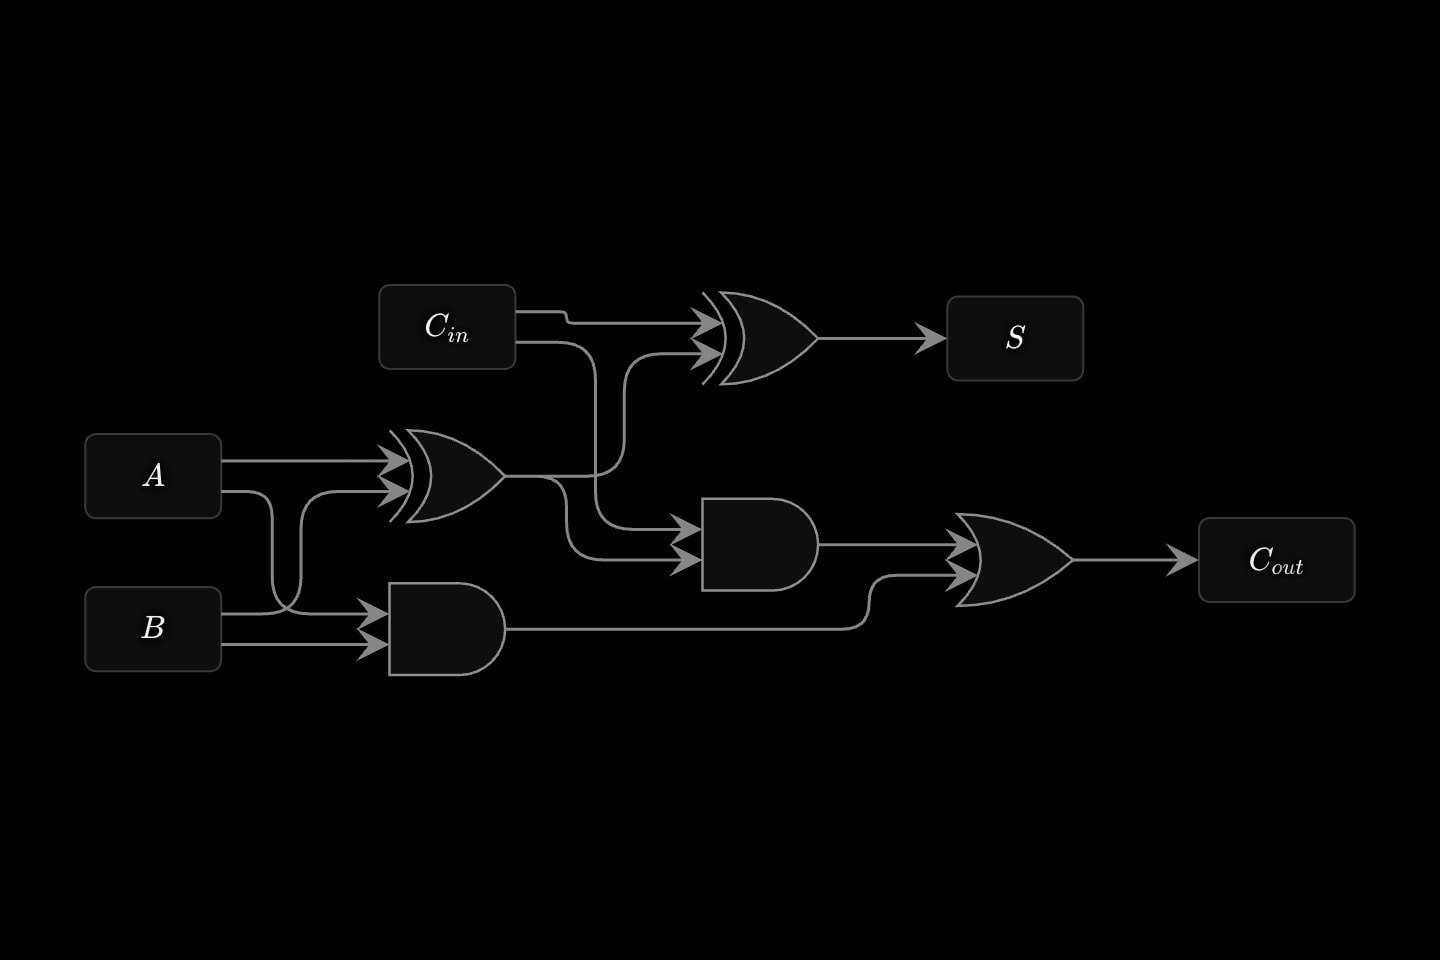
canvas.flowchart{
    box#a{$A$}
    box#b{$B$}
    box#cin{$C_{in}$}
    box#x1:xor{}
    box#x2:xor{}
    box#a1:and{}
    box#a2:and{}
    box#carry:or{}
    box#s{$S$}
    box#cout{$C_{out}$}

    arrow(from: #a; to: #x1)
    arrow(from: #b; to: #x1)
    arrow(from: #x1; to: #x2)
    arrow(from: #cin; to: #x2)
    arrow(from: #a; to: #a1)
    arrow(from: #b; to: #a1)
    arrow(from: #x1; to: #a2)
    arrow(from: #cin; to: #a2)
    arrow(from: #a1; to: #carry)
    arrow(from: #a2; to: #carry)
    arrow(from: #x2; to: #s)
    arrow(from: #carry; to: #cout)
}(
    direction: right
)
Entity–relationship diagrams take Chen's shapes: entity and weak-entity (rectangle, double rectangle), relationship and identifying-relationship (diamond, double diamond), and attribute, multivalued-attribute (double ellipse) and key-attribute (its name underlined). A cardinality is the arrow's label:.
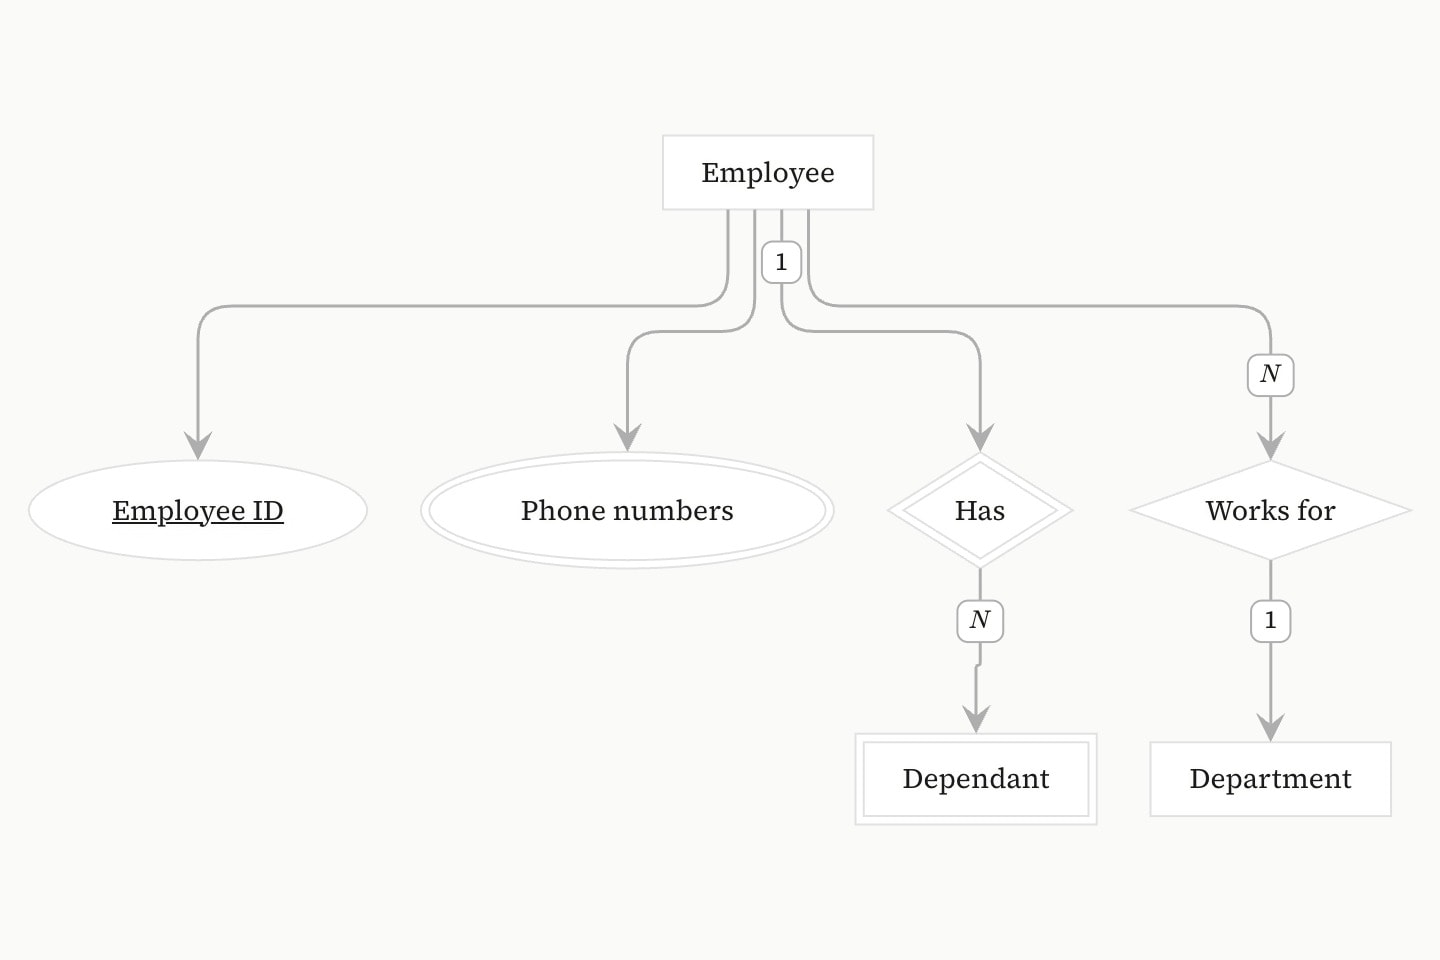
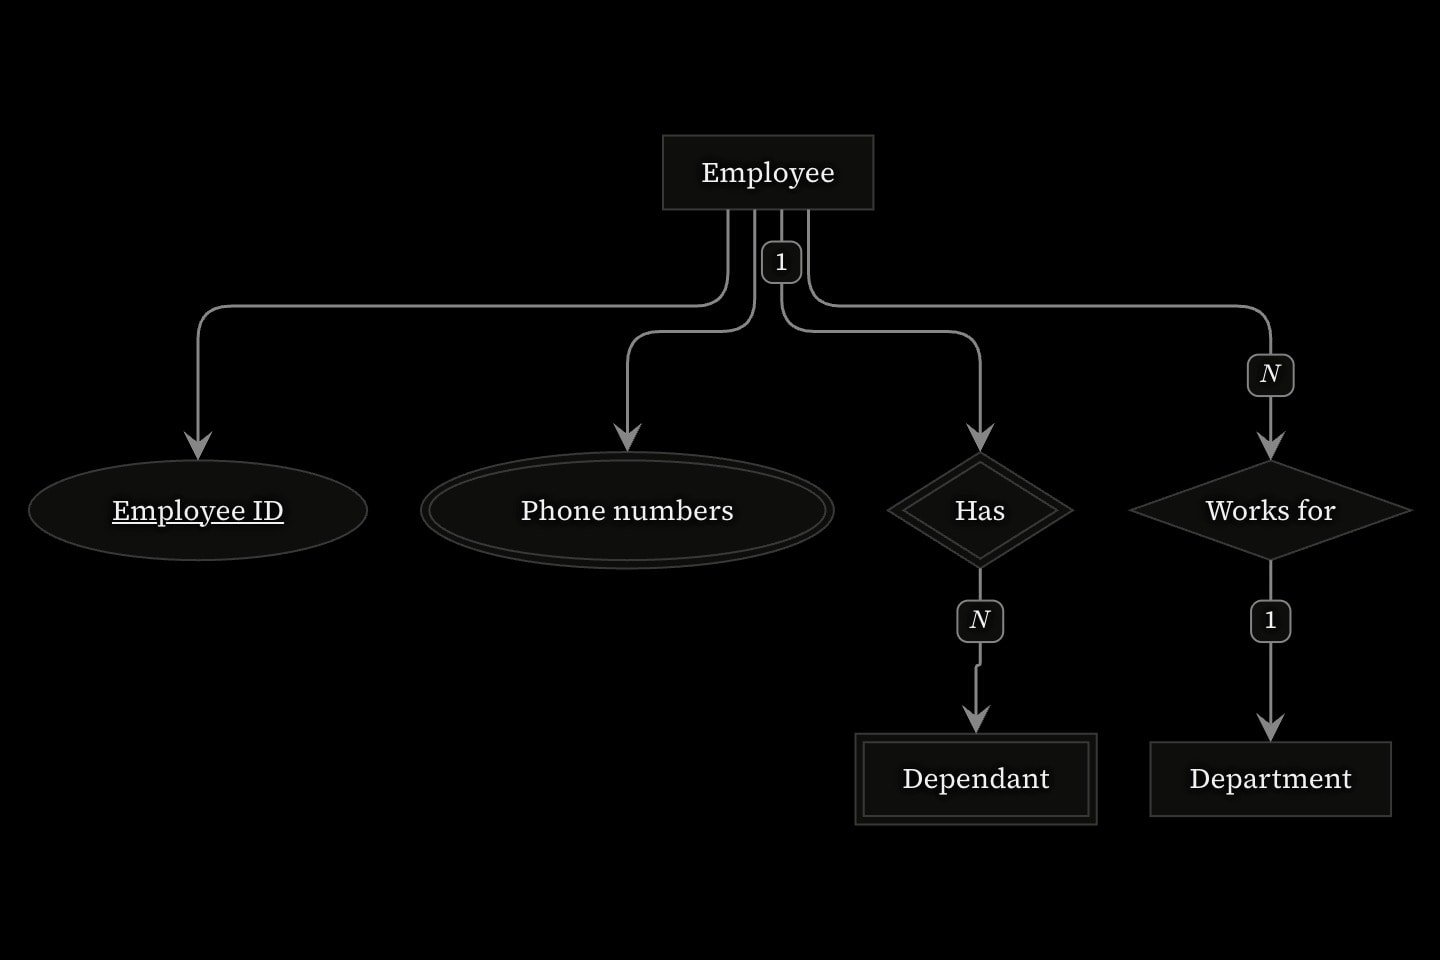
canvas.flowchart{
    box#emp:entity{Employee}
    box#id:key-attribute{Employee ID}
    box#phones:multivalued-attribute{Phone numbers}
    box#has:identifying-relationship{Has}
    box#dependant:weak-entity{Dependant}
    box#works:relationship{Works for}
    box#dept:entity{Department}

    arrow(from: #emp; to: #id)
    arrow(from: #emp; to: #phones)
    arrow(from: #emp; to: #has; label: 1)
    arrow(from: #has; to: #dependant; label: $N$)
    arrow(from: #emp; to: #works; label: $N$)
    arrow(from: #works; to: #dept; label: 1)
}(
    direction: down
)
A box says what kind of thing it is with group:, never what colour to be. Boxes of one group share a hue, and the footer keys each group beside a box in its colour. The environment's hues: pins the groups whose colour means something — hues: Quantitative = blue, Qualitative = teal — and any other group is dealt the next hue no pin has taken. A box's own colour: still wins, and !legend turns the key off.
#Placing a box by hand
A box with at: sits out of the arrangement at that fraction of the frame — a legend beside a flowchart, a caption box on an image. Everything else still arranges around it.
#focus, zoom and the glide
The frame is a camera. focus: takes a fractional point or #id naming a box or pin the environment already draws, and zoom: multiplies over the fitted frame — omitted, the content fits the environment. Both are animatable, so one !cue.to on each glides into a feature as the narrative reaches it; interactive additionally hands the reader wheel-zoom and drag, with a double-click back to the authored frame.
canvas.flowchart:cell-micrograph.jpg{
    pin#nucleus(at: 0.62, 0.31; label: Nucleus)
}(
    focus: 0.5, 0.5 !cue.to{#nucleus}(at: 1; over: 800ms)
    zoom: 1 !cue.to{3}(at: 1; over: 800ms)
)#Attributes
imageimage names one. Normally written in the head, canvas.flowchart:cell.jpg. Omitted, the environment's frame is the arranged extent of its boxes.src, sourceCan be written as shorthand: canvas.flowchart:valuedirectiondown, up, right or left. A chart longer than the environment wraps rather than shrinking, so boxes keep the size their text needs. Plain, it snakes: the next line reads back the other way. A strictly- direction keeps every line reading the one way — each starts again at the beginning beside the last, the way lines of text do — and the arrows across a fold are carried back along the gap between the lines.downuprightleftstrictly-downstrictly-upstrictly-rightstrictly-leftdowntitlehues=, its colour — hues: Quantitative = blue, Theory = purple. Any group not pinned here is dealt the next hue no pin has taken.flowchart-hueslegendgroup:. !legend turns it off.truefocus#id naming a box or pin this environment already draws — so a frame aimed at a feature it also labels states that feature once. Animatable with !cue.to; absent, the frame centres.zoom!cue.to. NO default: an omitted zoom is auto — the content fits the environment — and zoom: 1 written out means exactly the fit.interactivefalsecontinuecontinue: #that-environment. The reader's explored camera carries forward; every authored attribute is the new environment's own.#Allowed content
#Allowed in
#Examples
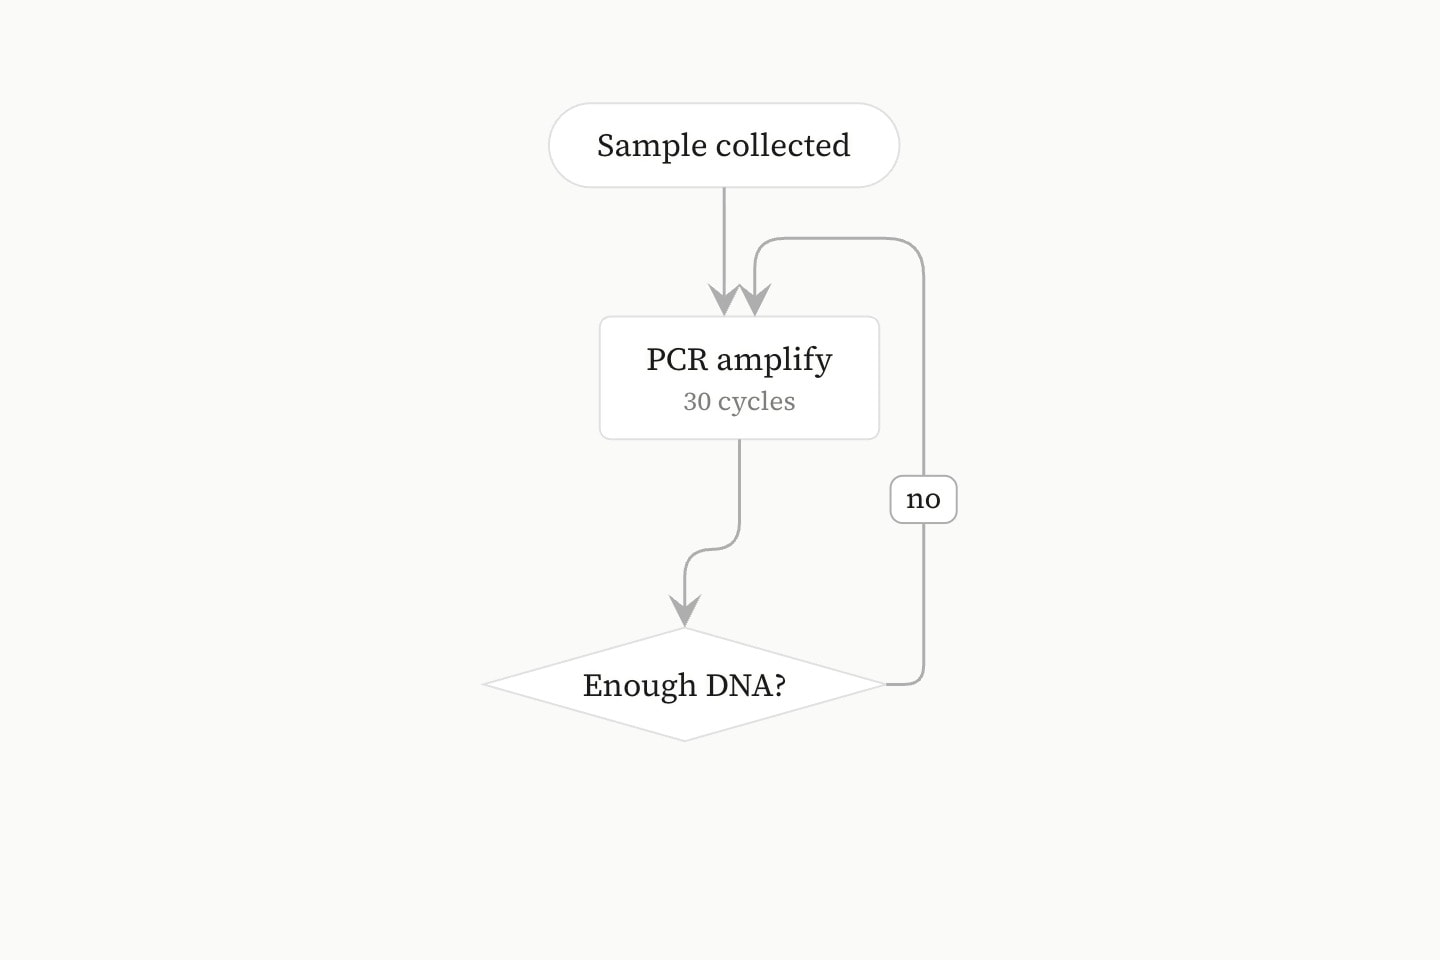
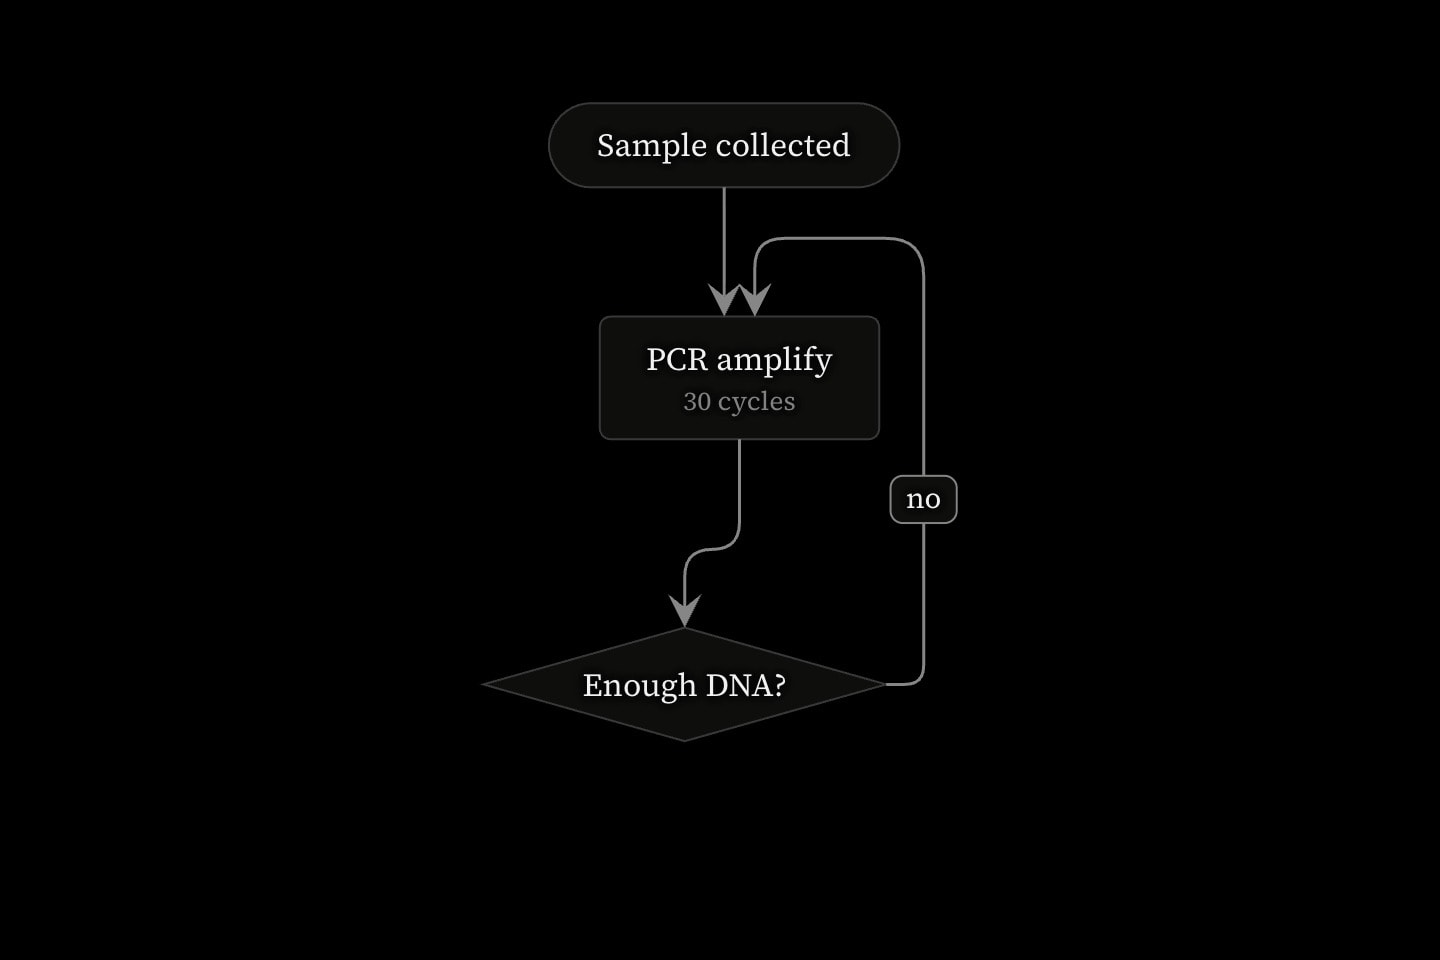
canvas.flowchart{
    box#sample:terminal{Sample collected}
    box#pcr{
        PCR amplify
        30 cycles
    }
    box#check:decision{Enough DNA?}
    arrow(from: #sample; to: #pcr)
    arrow(from: #pcr; to: #check)
    arrow(from: #check; to: #pcr; label: no)
}(
    direction: down
)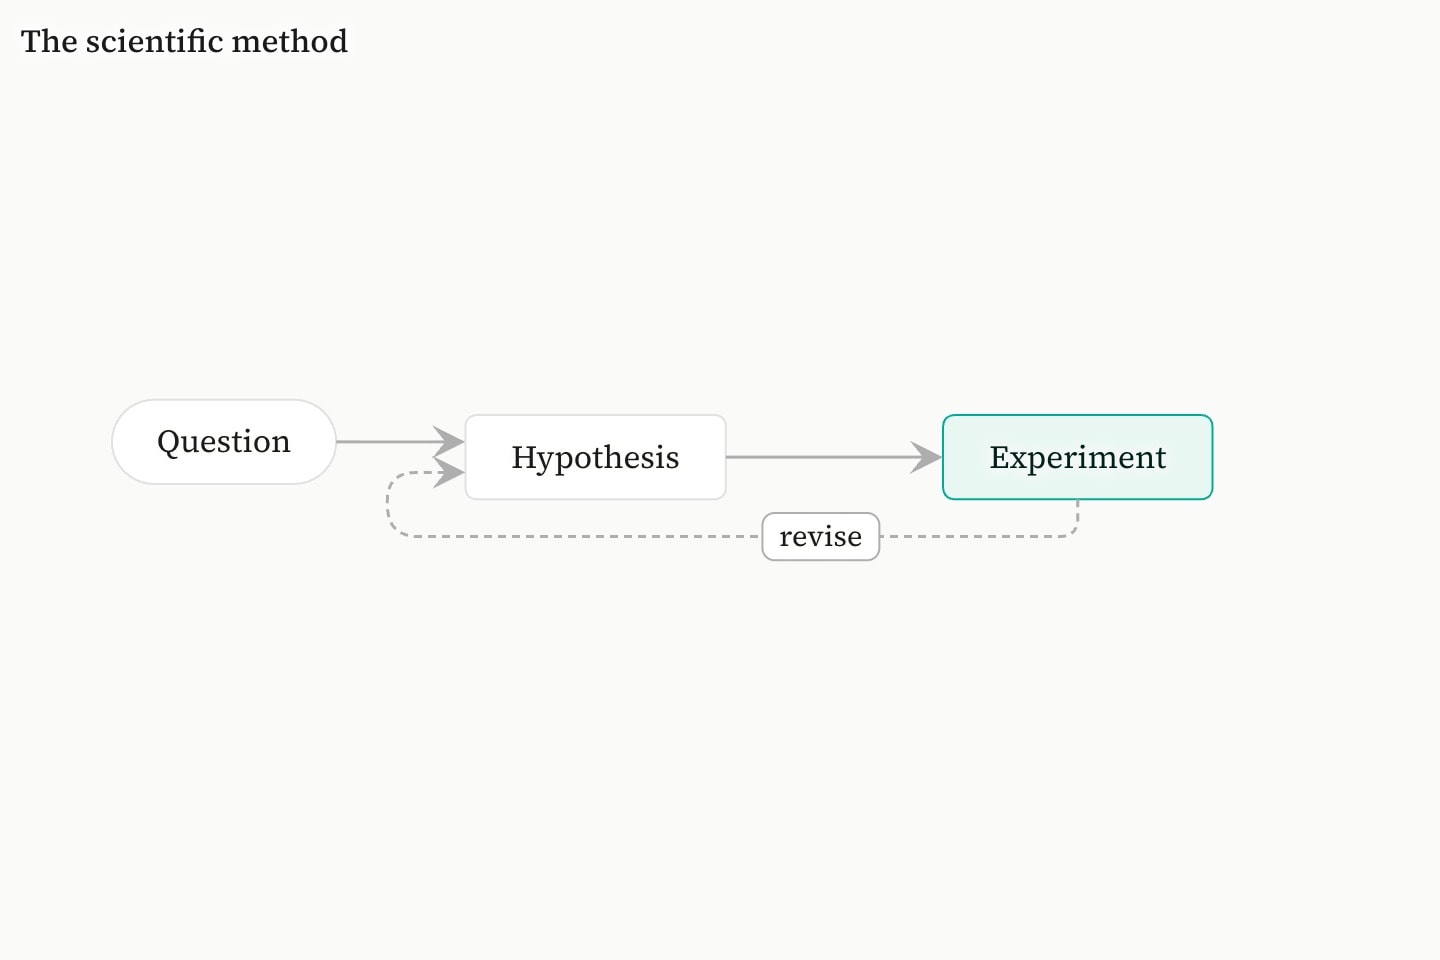
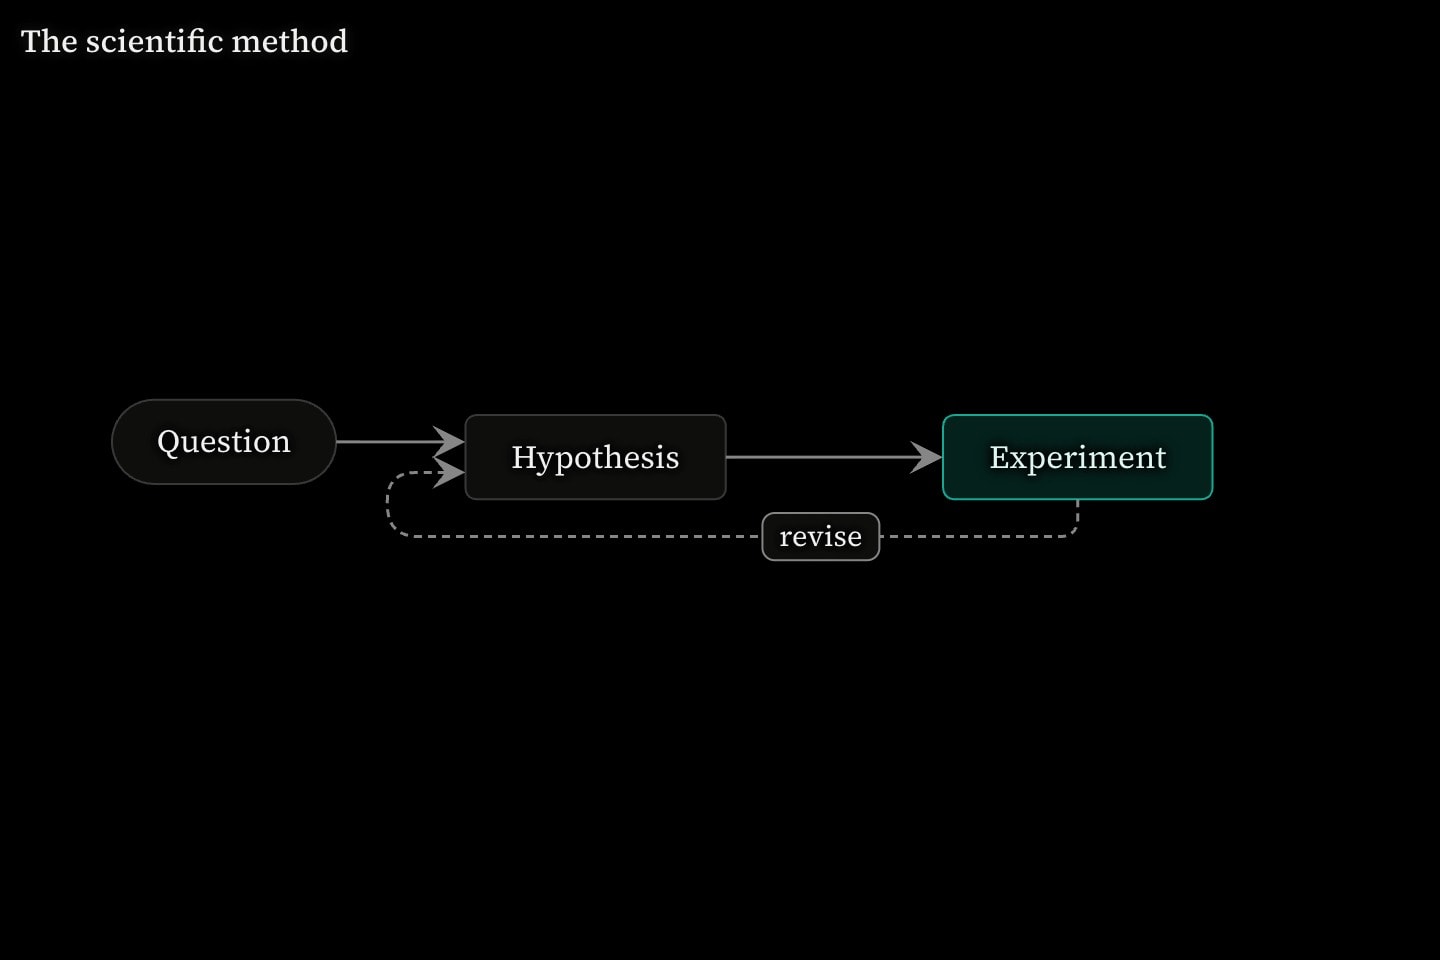
canvas.flowchart{
    box#question:terminal{Question}
    box#hypothesis{Hypothesis}
    box#experiment{Experiment}(colour: teal)
    arrow(from: #question; to: #hypothesis)
    arrow(from: #hypothesis; to: #experiment)
    arrow(from: #experiment; to: #hypothesis; label: revise; dashed: true)
}(
    direction: right
    title: The scientific method
)

canvas.flowchart{
    box#dna{DNA}
    box#rna{RNA}
    cue.draw{
        arrow(from: #dna; to: #rna; label: transcription)
    }(
        in: 1
    )
}(
    direction: right
)