canvas.network
A network environment on the scene's canvas: a graph in the discrete-maths sense, a network in the network-science sense, or a causal diagram. Vertices are placed by the named layout: and the environment measures what was written — degree, betweenness, components, communities, shortest paths — and can draw those measurements back onto the picture through the vertices and edges tables' size-by:, colour-by: and width-by: — encodings live on the tables, never on the environment. The layout and every measurement are taken from the whole declared network, whatever step each part arrives on, so nothing moves and no cited number changes as a later cue reveals more of it. Edges are written one at a time with edge, or bound from an edge list with edges, and the two mix. Positions are fractions of the frame, top-left origin, y DOWN, as in canvas.diagram. The frame is a camera: focus: names what it looks at — fit, #ids of vertices or paths, or a point — and the camera finds the zoom from it; animated with !cue.to, it flies between frames. Vertices keep their size as the frame closes in.
canvas.network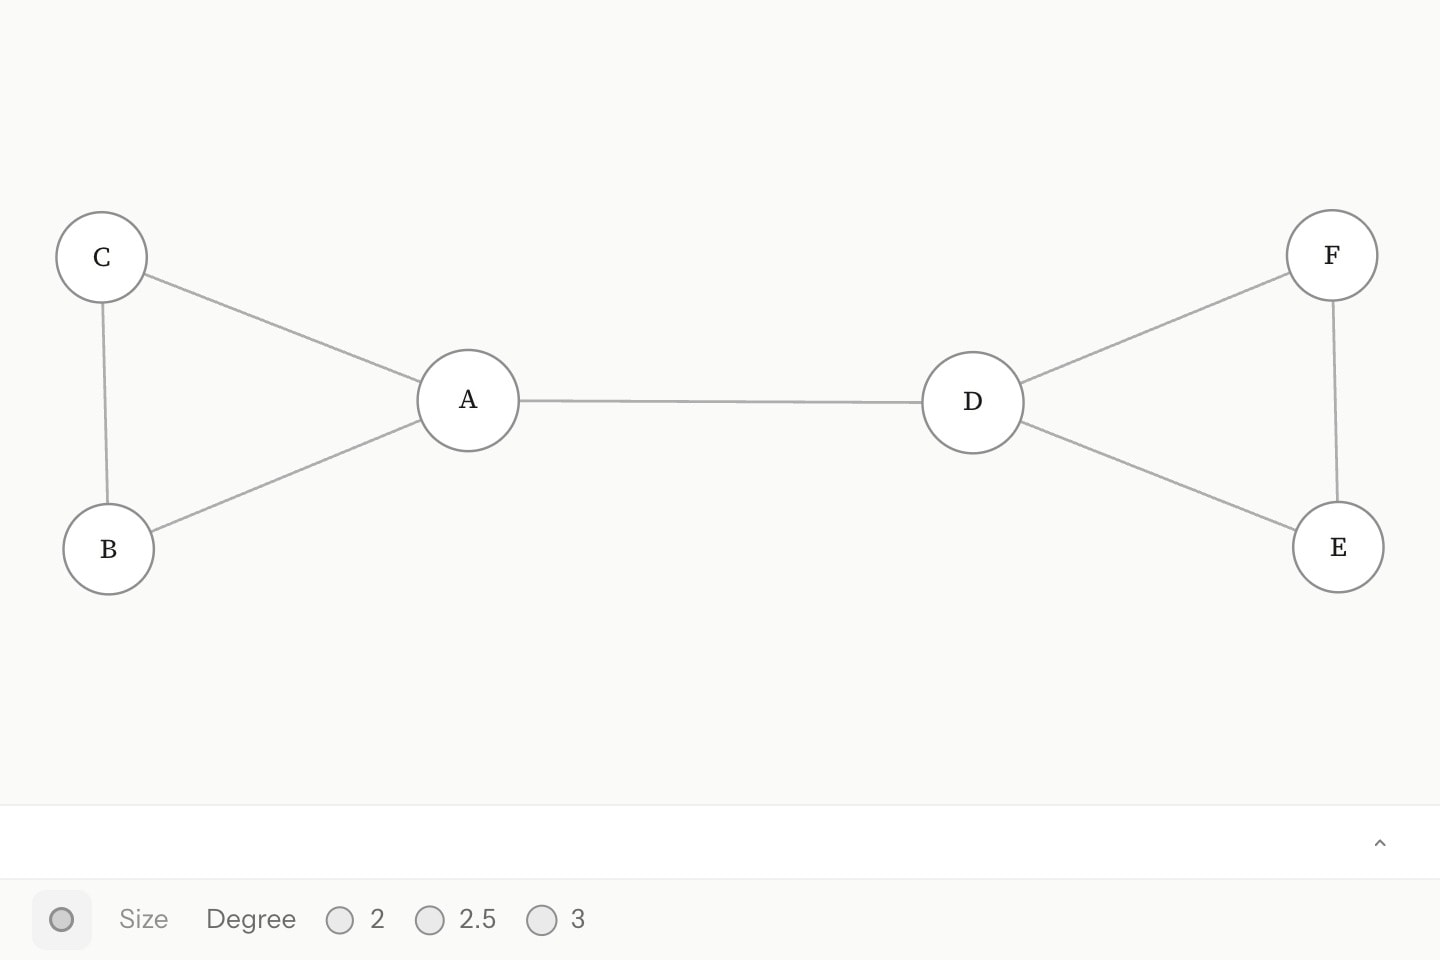
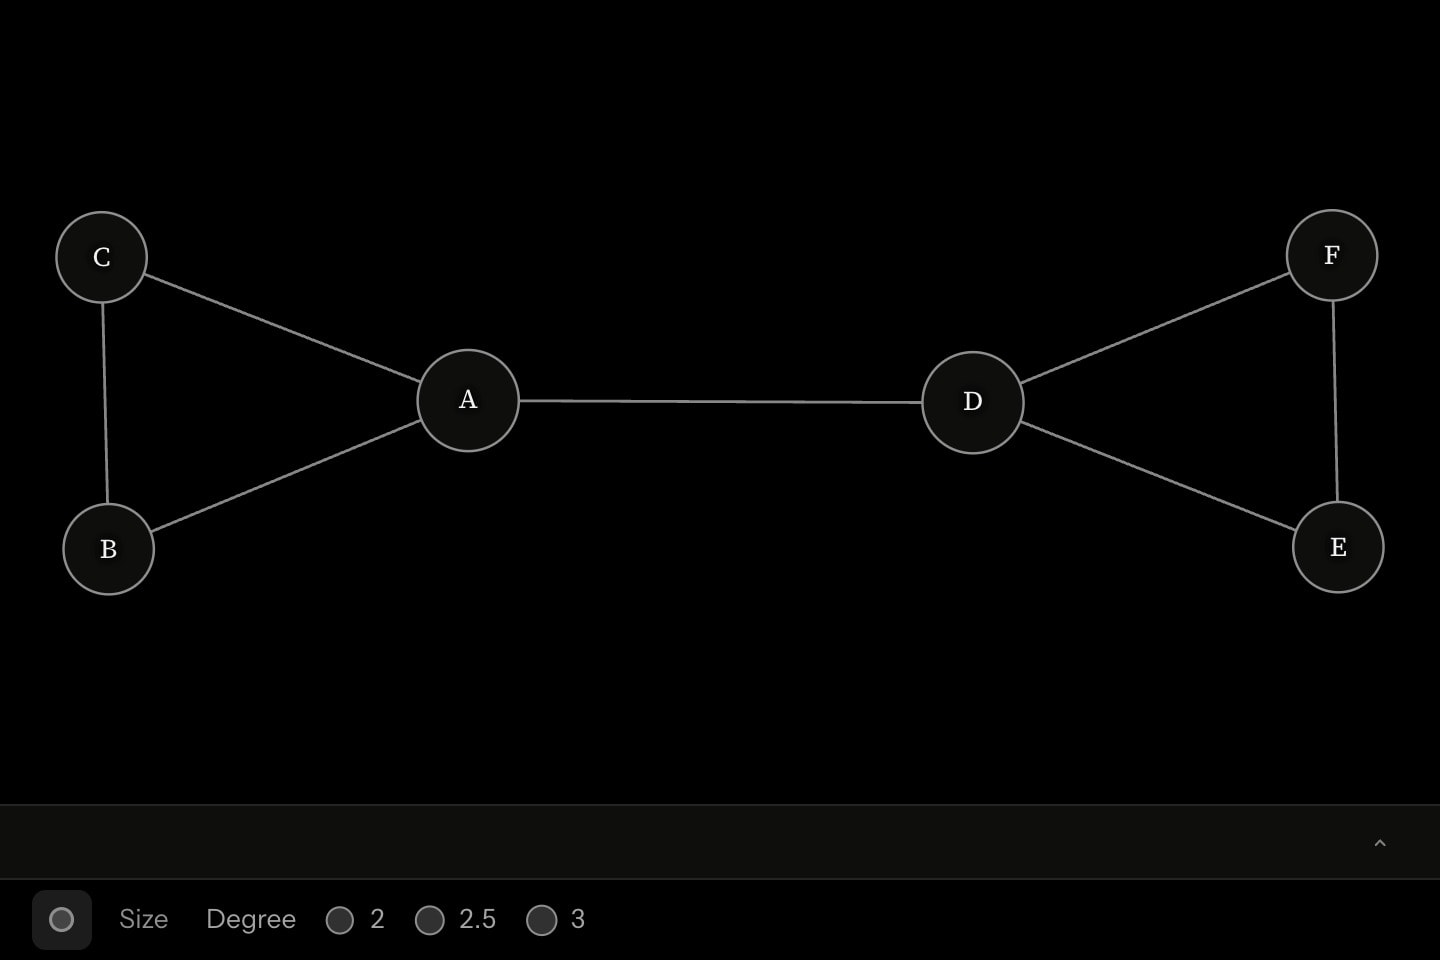
#The network environment
canvas.network draws structure as the subject: a graph in the discrete-maths sense, a social or citation network, a food web, a causal loop. A vertex is a point with a name — its body is its label — and an edge joins two of them by #id. The environment places the vertices, and measures what was written.
A network is undirected unless direction: says otherwise. direction: arrows makes every edge run from from to to: edges carry heads, in- and out-degree are counted apart, and a path follows the edges' direction. Two edges between the same pair bow apart so both stay visible, and an edge from a vertex to itself is a loop over it. sign: positive or negative puts a + or − beside an edge's head, and shape: none draws a vertex as its words alone — together, a causal-loop diagram.
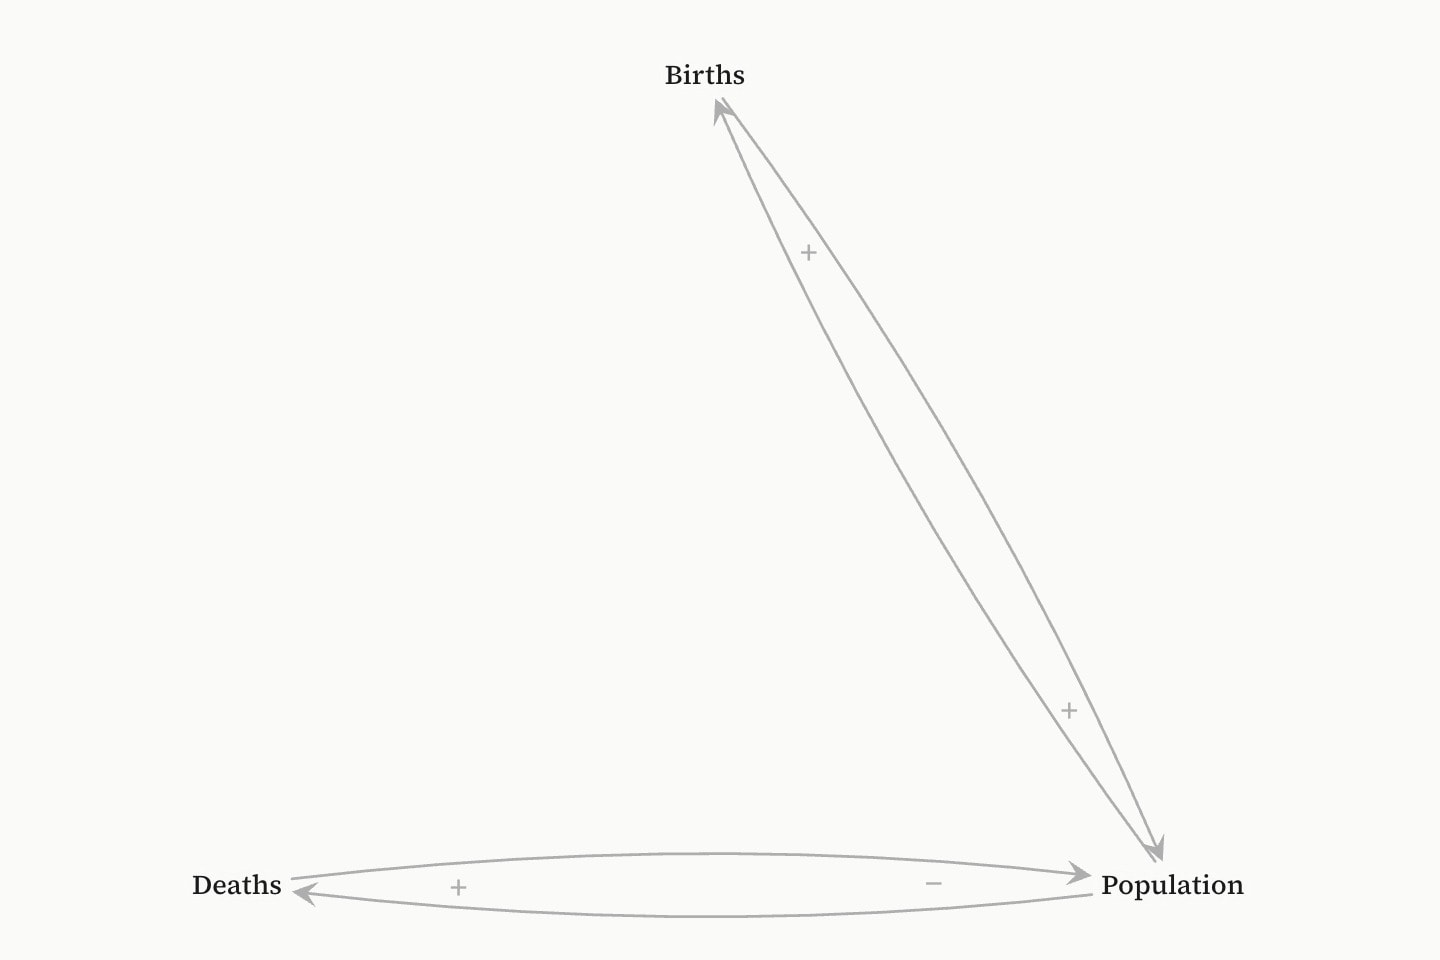
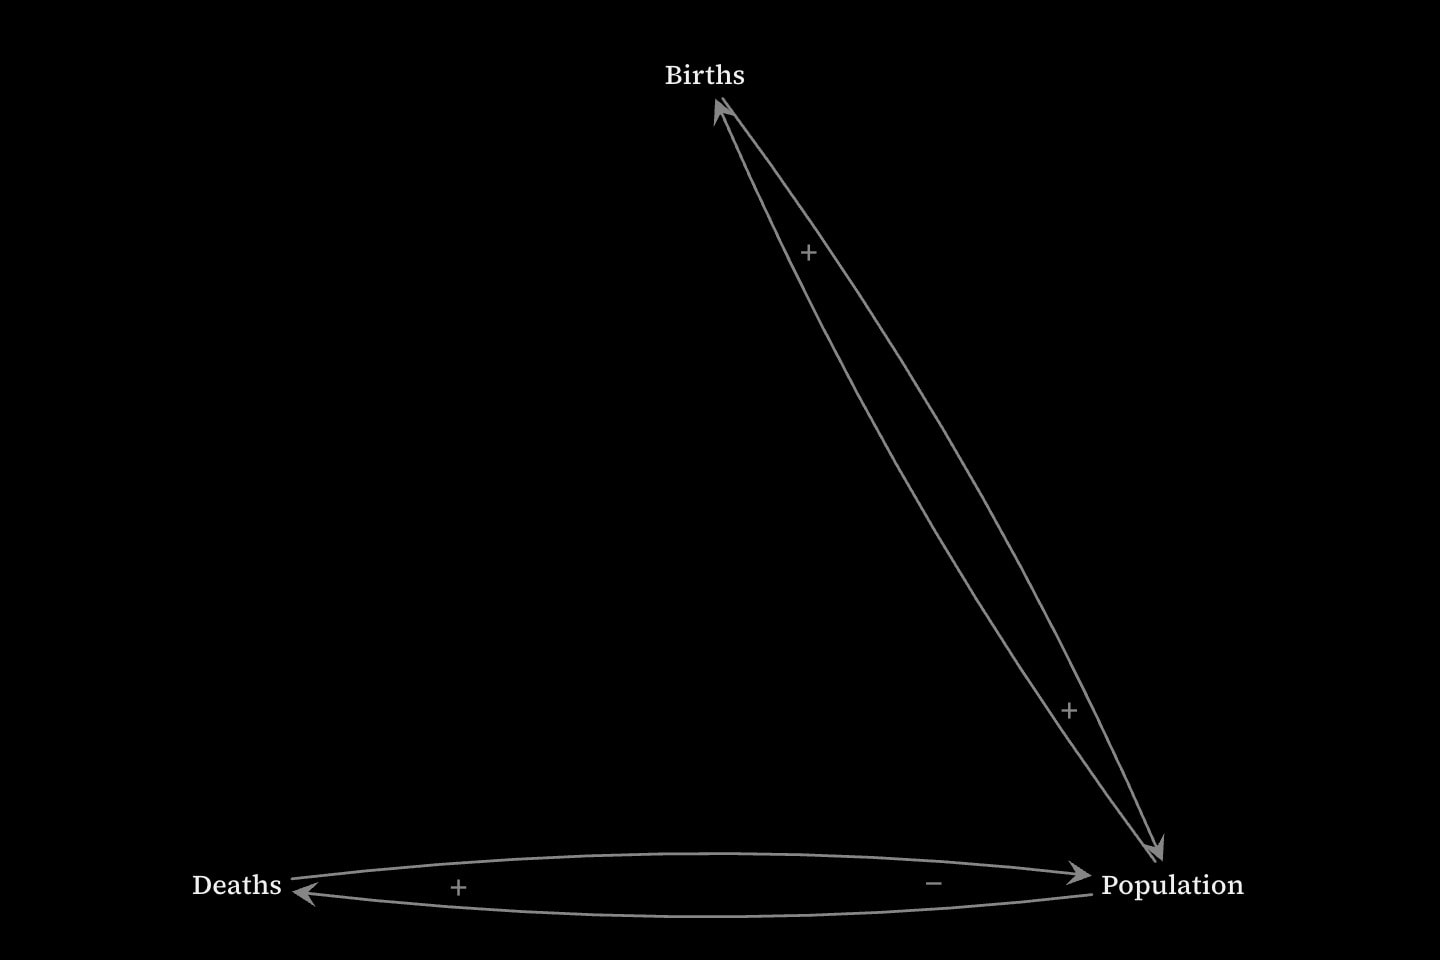
canvas.network:circle{
    vertex#births{Births}(shape: none)
    vertex#population{Population}(shape: none)
    vertex#deaths{Deaths}(shape: none)

    edge(from: #births; to: #population; sign: positive)
    edge(from: #population; to: #births; sign: positive)
    edge(from: #population; to: #deaths; sign: positive)
    edge(from: #deaths; to: #population; sign: negative)
}(
    direction: arrows
)
On a crowded directed network, heads pile up round every popular vertex. direction: curves is the same directed network with no heads: each edge bows to the right of the way it travels, so read clockwise, an edge runs forward, and two vertices pointing at each other get two separate curves.
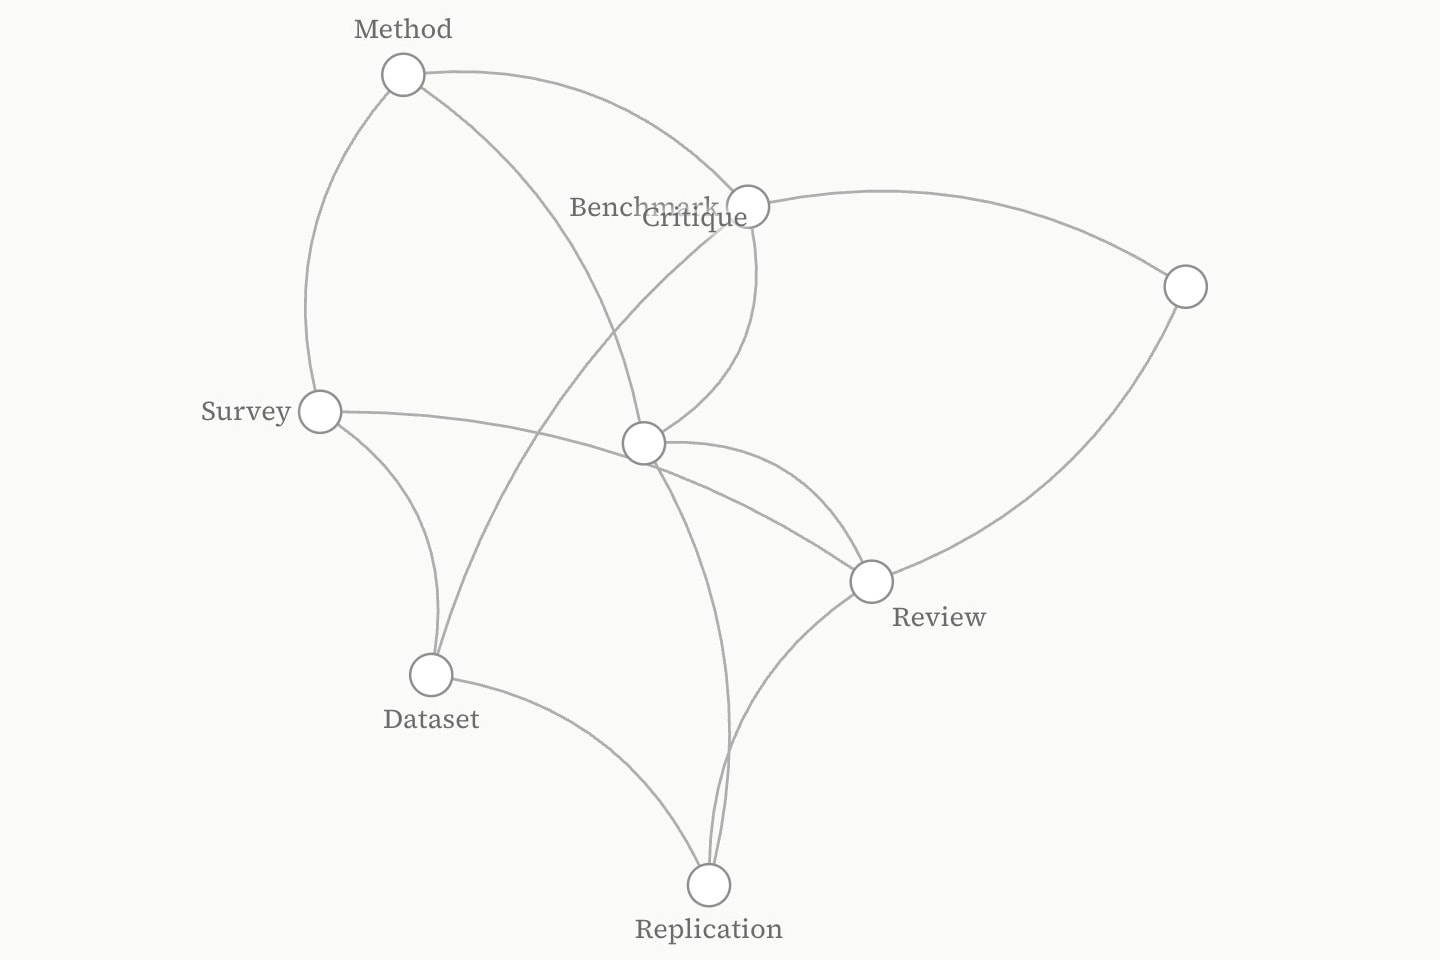
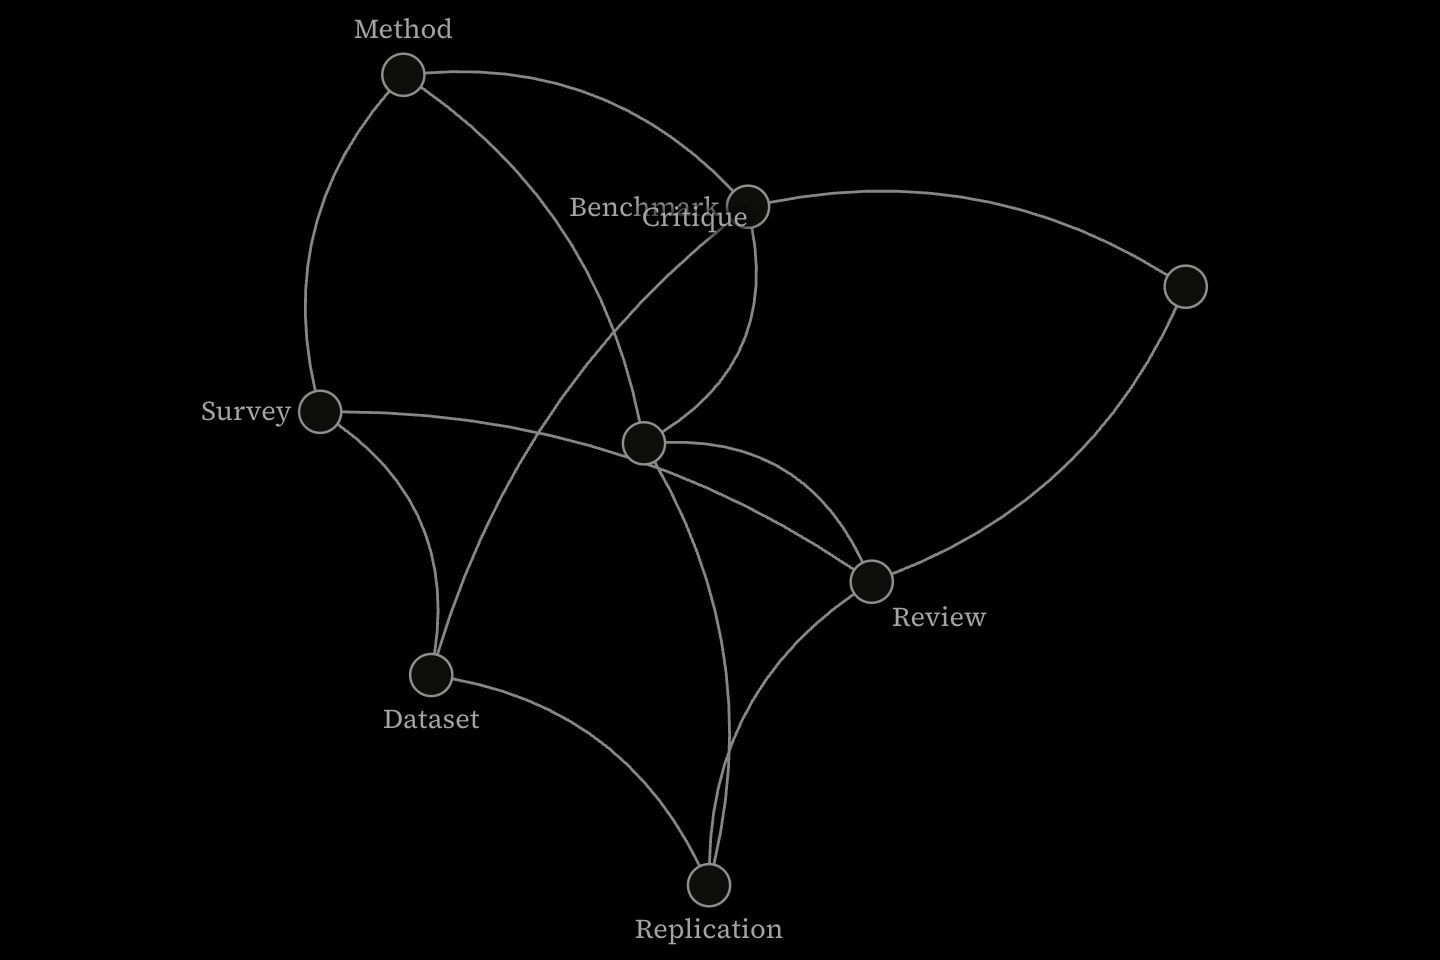
@data#citations{
    paper       | cites
    Method      | Survey
    Dataset     | Survey
    Benchmark   | Method
    Benchmark   | Dataset
    Extension   | Method
    Extension   | Benchmark
    Critique    | Benchmark
    Replication | Extension
    Replication | Dataset
    Review      | Extension
    Review      | Critique
    Review      | Replication
    Review      | Survey
}

canvas.network{
    edges(from: #citations.paper; to: #citations.cites)
}(
    direction: curves
)
canvas.diagram also draws things joined by arrows. The difference is what the picture is for: a diagram routes arrows round boxes of text to say what leads to what, and a network is measured.
#Layouts
layout: is the implicit attribute, so canvas.network:circle{…} names its layout in the head. force, the default, draws connected vertices together and pushes every vertex away from the others. It is seeded, so it comes out the same every time; a different seed: is a different arrangement of the same network. circle sets the vertices round a ring, each group: kept together, and grid sets them in rows in the order written.
Three layouts rank the vertices instead. tree hangs a spanning tree from root:, each parent centred over its children. layered ranks a directed network so its edges run one way. flow: right turns either on its side.
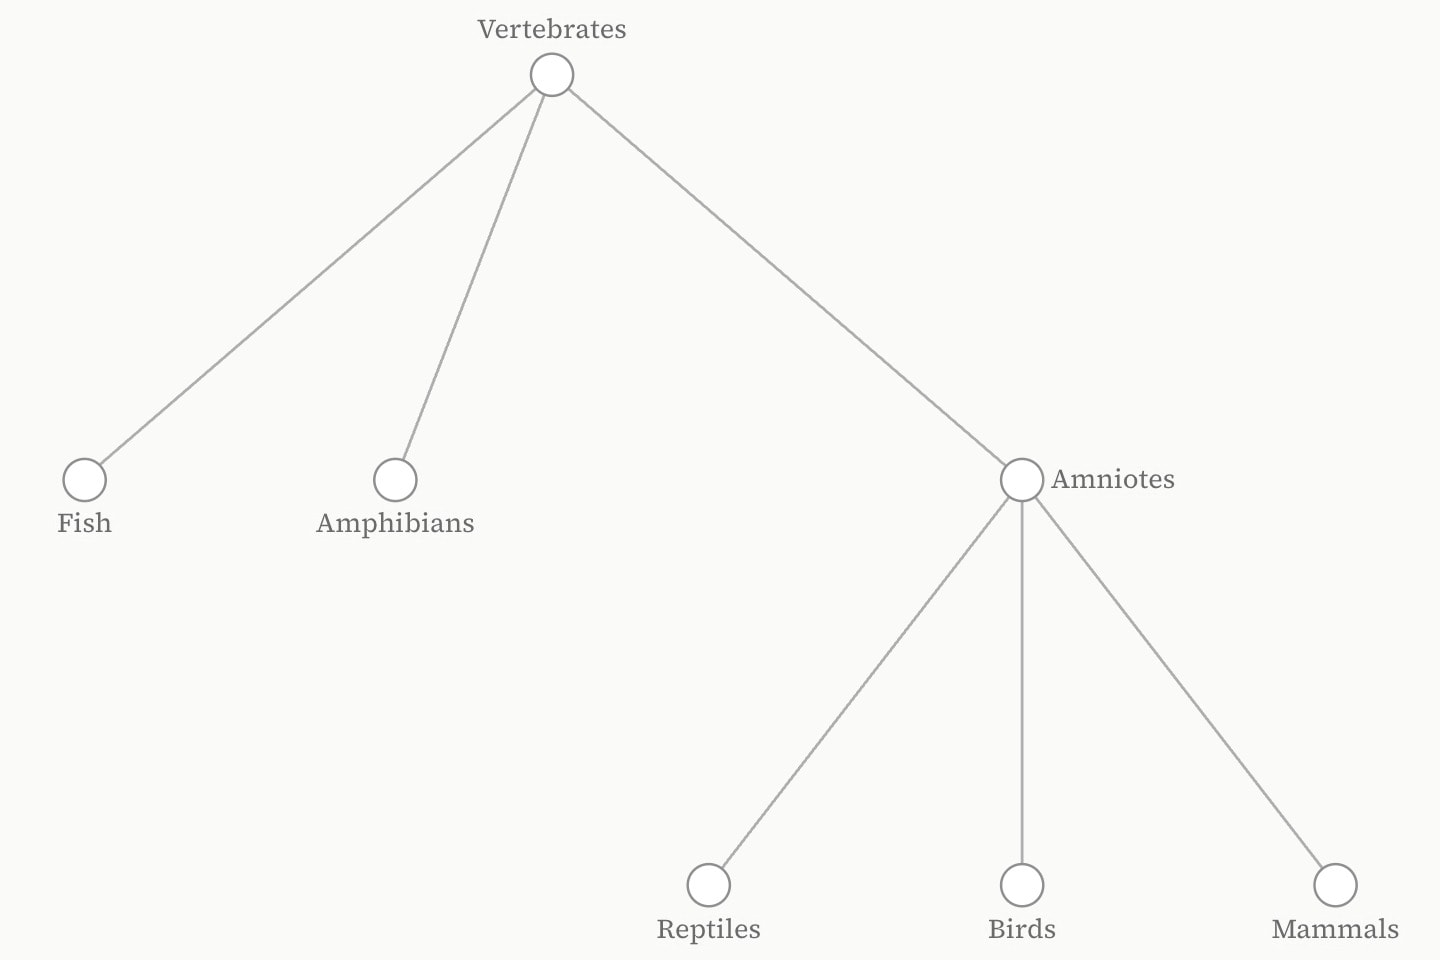
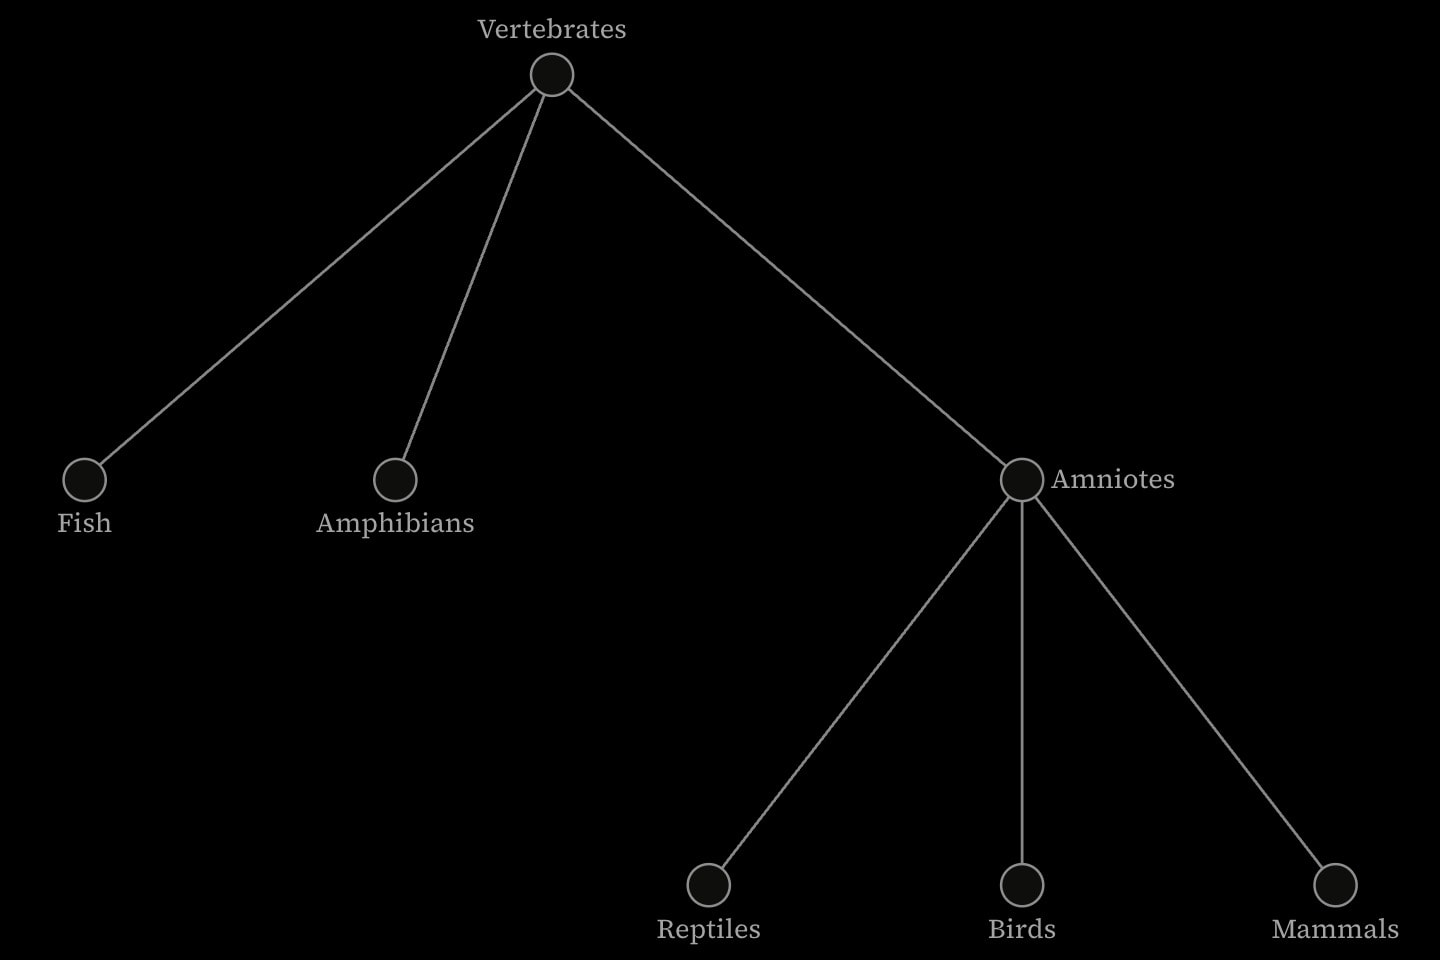
canvas.network:tree{
    vertex#vertebrates{Vertebrates}
    vertex#fish{Fish}
    vertex#amphibians{Amphibians}
    vertex#amniotes{Amniotes}
    vertex#reptiles{Reptiles}
    vertex#birds{Birds}
    vertex#mammals{Mammals}

    edge(from: #vertebrates; to: #fish)
    edge(from: #vertebrates; to: #amphibians)
    edge(from: #vertebrates; to: #amniotes)
    edge(from: #amniotes; to: #reptiles)
    edge(from: #amniotes; to: #birds)
    edge(from: #amniotes; to: #mammals)
}(
    root: #vertebrates
)
bipartite sets the two sides of a two-sided network on two ranks: the two group:s when exactly two are written — here as each vertex's implicit attribute, vertex#ana:students{Ana} — and otherwise the sides a two-colouring finds.
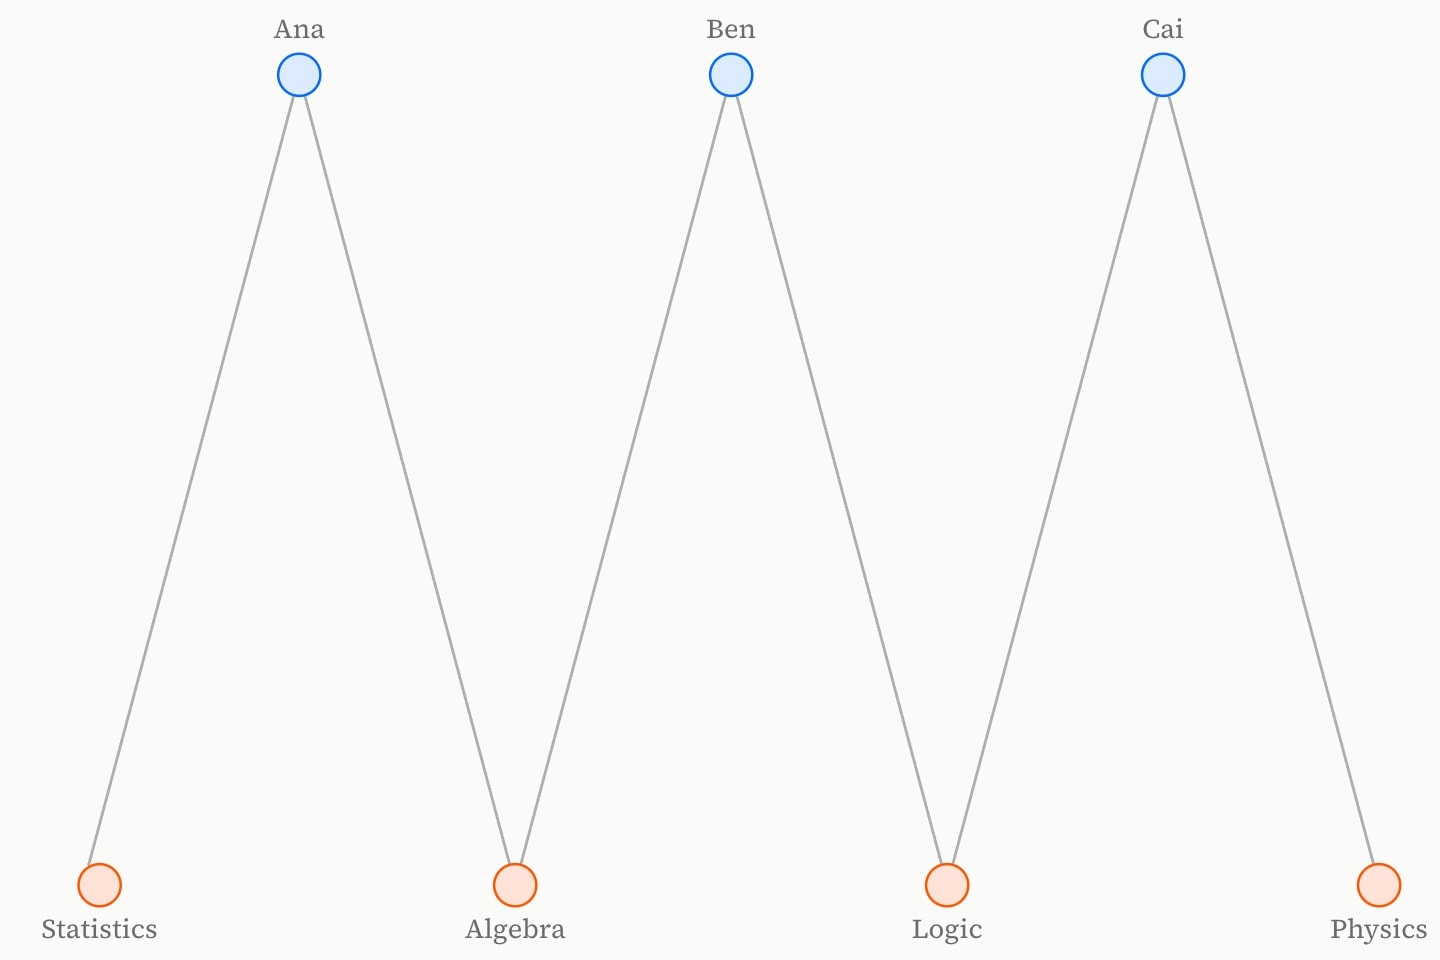
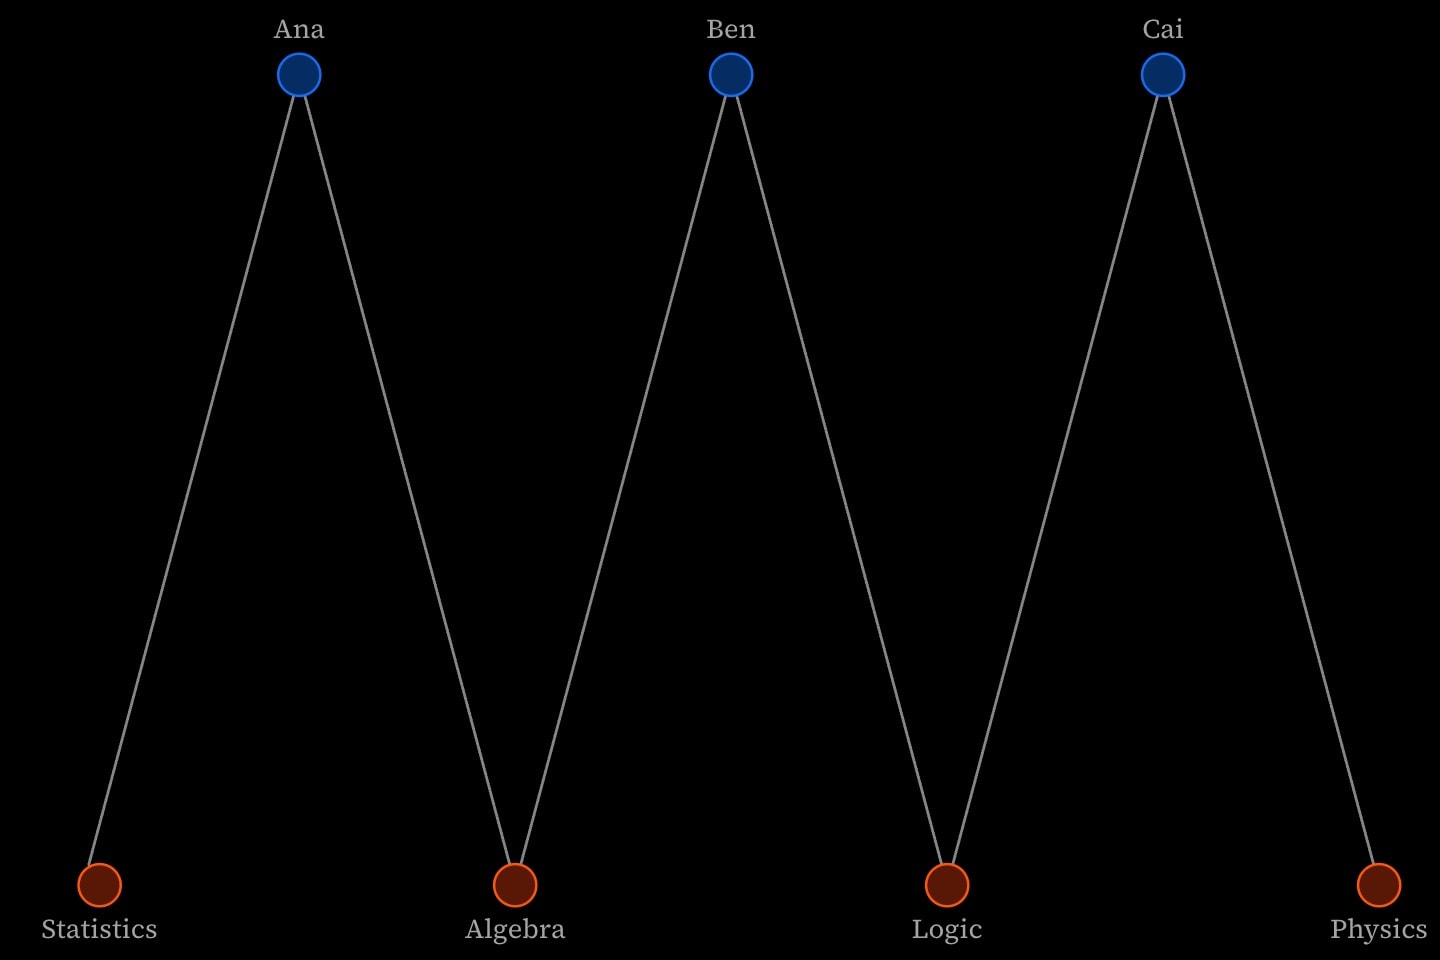
canvas.network:bipartite{
    vertex#ana:students{Ana}(colour: blue)
    vertex#ben:students{Ben}(colour: blue)
    vertex#cai:students{Cai}(colour: blue)
    vertex#stats:modules{Statistics}(colour: orange)
    vertex#algebra:modules{Algebra}(colour: orange)
    vertex#logic:modules{Logic}(colour: orange)
    vertex#physics:modules{Physics}(colour: orange)

    edge(from: #ana; to: #stats)
    edge(from: #ana; to: #algebra)
    edge(from: #ben; to: #algebra)
    edge(from: #ben; to: #logic)
    edge(from: #cai; to: #logic)
    edge(from: #cai; to: #physics)
}#Placing a vertex by hand
A vertex with at: sits at that fraction of the frame — top-left origin, y down, as in canvas.diagram. The force layout arranges the others around it; the rest leave it out of their arrangement. at: is animatable, and the layout reads its first value, so a keyframe moves that vertex alone.
#Networks from @data
edges binds an edge list: one edge per row, endpoints named by two columns, and weights: a third. Each distinct cell is a vertex labelled with its text. vertices binds a vertex table: one vertex per row, keyed by names:, which an edge list's cells are matched against. A table's vertex with no edges is drawn on its own.
An inline vertex whose label or id matches a name — case and spacing aside — is that vertex, which is how a data vertex is coloured, pinned, or given an #id to point a path at. Inline edges, edge lists and vertex tables mix freely.
#Drawing the data on the network
Colour and size are set on the tables, never on the environment, so each table's rows follow their own rule. The columns draw what the network cannot measure — the data's own numbers and categories. On a vertex table, sizes: gives each vertex an area in proportion to a numeric column and groups: sorts them for colour by: group. On an edge list, widths: draws a numeric column as stroke width and groups: sorts the edges into kinds, each in its own hue under colour by: group. Every such attribute names a column, which is why they are plural.
An edge list can instead take its colour from the vertices each edge joins. colour by: ends draws an edge in the colour its two ends share, and an even mix of the two where they differ; colour by: gradient runs from the colour of the vertex it leaves to the colour of the one it reaches.
The data says what a vertex or an edge is, never what colour to draw it: each group is dealt a hue from one palette — vertex groups first, then edge groups — so no hue means two things in one picture. Where a hue carries meaning, the table's hues: pins it: hues: motorway = red, other road = grey. The groups it does not name are dealt from what is left. Where the data's spelling is not what a reader should see, hue labels: renames a group in the key alone: hue labels: neutral = Neutral.
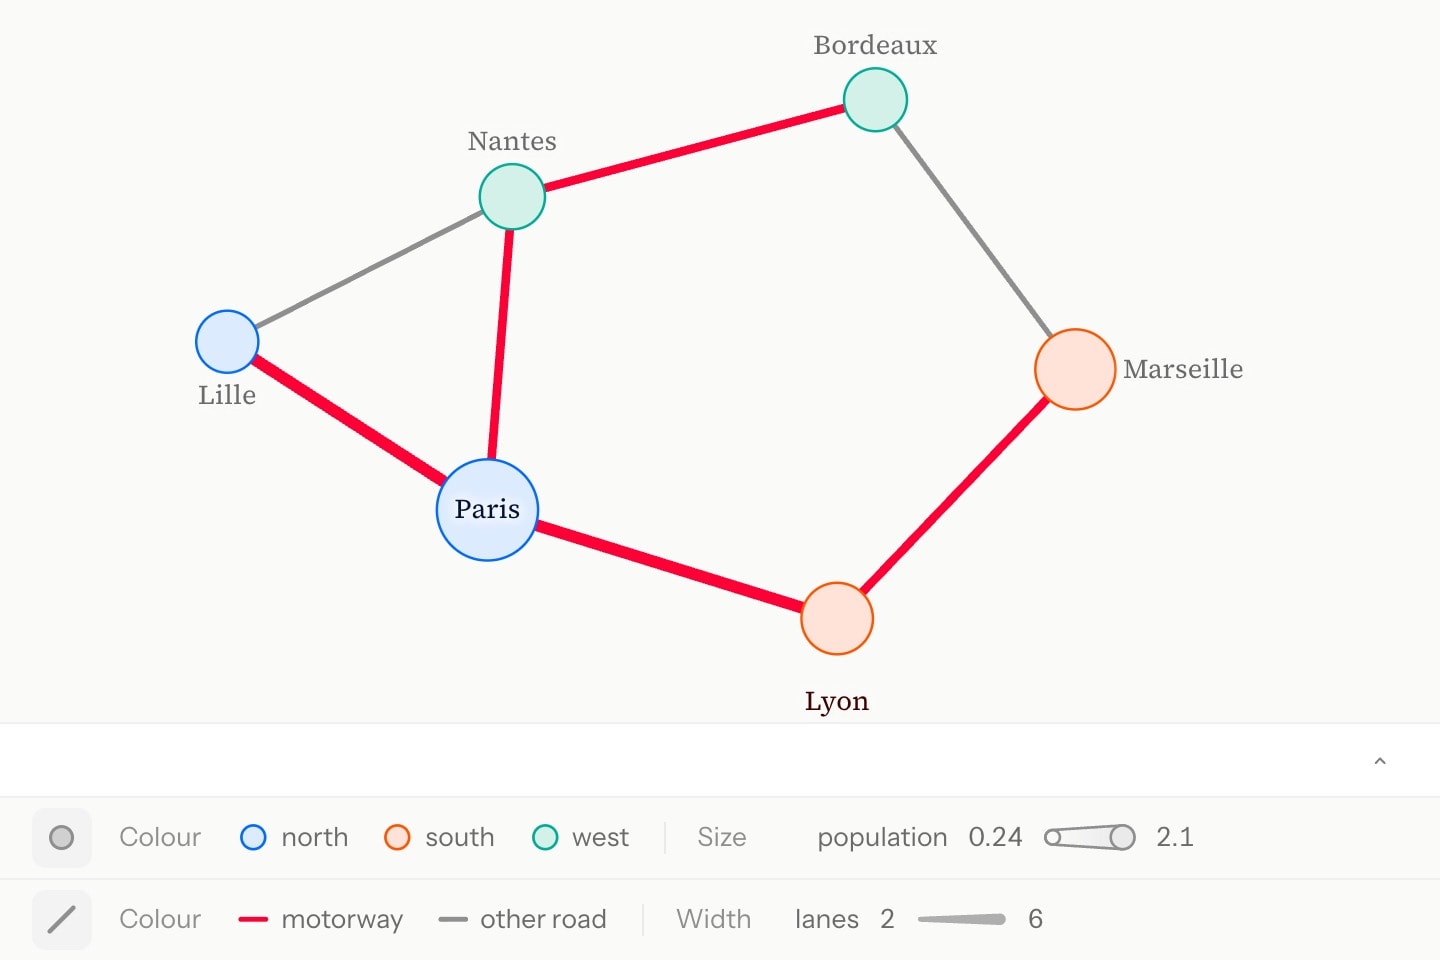
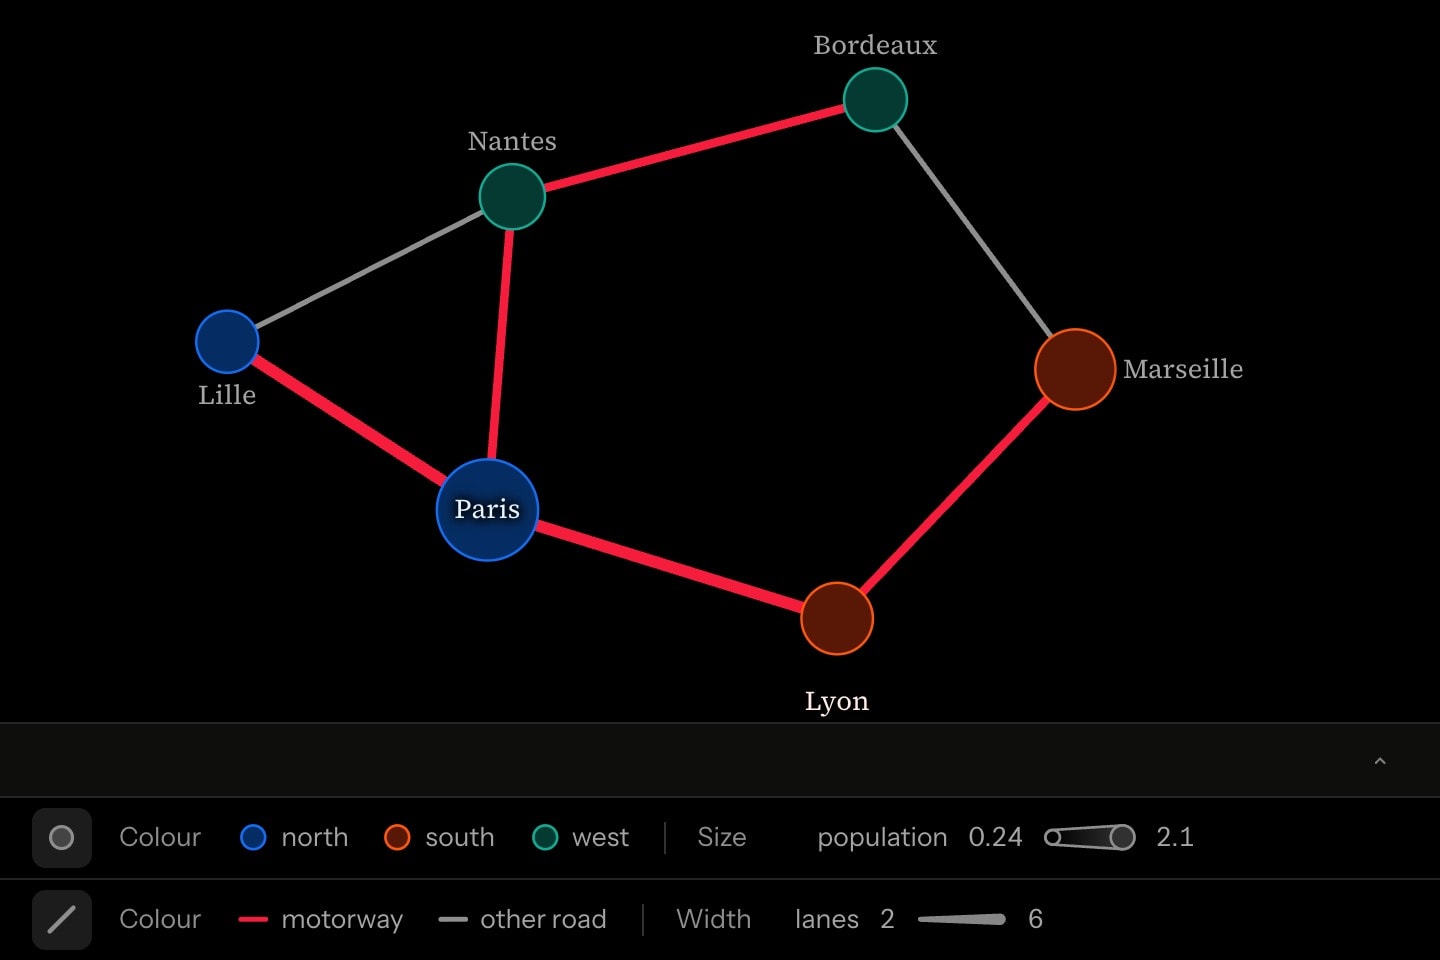
@data#cities{
    city      | population | region
    Paris     | 2.10       | north
    Lille     | 0.24       | north
    Lyon      | 0.52       | south
    Marseille | 0.87       | south
    Bordeaux  | 0.26       | west
    Nantes    | 0.32       | west
}

@data#roads{
    from      | to        | km  | lanes | kind
    Paris     | Lille     | 225 | 6     | motorway
    Paris     | Lyon      | 465 | 6     | motorway
    Lyon      | Marseille | 315 | 4     | motorway
    Paris     | Nantes    | 385 | 4     | motorway
    Nantes    | Bordeaux  | 345 | 4     | motorway
    Bordeaux  | Marseille | 645 | 2     | other road
    Lille     | Nantes    | 590 | 2     | other road
}

canvas.network{
    vertices(names: #cities.city; sizes: #cities.population; groups: #cities.region; colour by: group)
    edges(from: #roads.from; to: #roads.to; weights: #roads.km; widths: #roads.lanes; groups: #roads.kind; colour by: group; hues: motorway = red, other road = grey)
}
The footer keys whatever a reader could not decode unaided: the hue of each group, vertex and edge alike, and what vertex area and edge width stand for, as a wedge from the least reading to the greatest. Communities and components are not keyed: their colours are numbered arbitrarily, and the clusters show themselves. Nor is an edge coloured from its ends, whose colours are the vertices'. !legend turns the key off.
Hovering a vertex fades everything outside its reach. On a directed network that is what lies downstream of it — the vertices its edges point to, and theirs, and the edges on the way; on an undirected one, its whole connected piece of the network.
weights: and widths: are different claims. A weight is what the network measures an edge by — here the kilometres a shortest path adds up — and widths: is only drawn: the lanes, which make a road look major without making it any shorter.
Two bindings draw a network as large as its data. Below, 160 researchers and the 342 papers they wrote together — generated for the example, not collected — each vertex sized by its author's papers and coloured by department. A label is set only where it has room: inside a vertex large enough to hold it, or beside one on a side its edges leave clear, without covering another vertex or label or leaving the frame. A vertex whose label has no room shows it on hover.
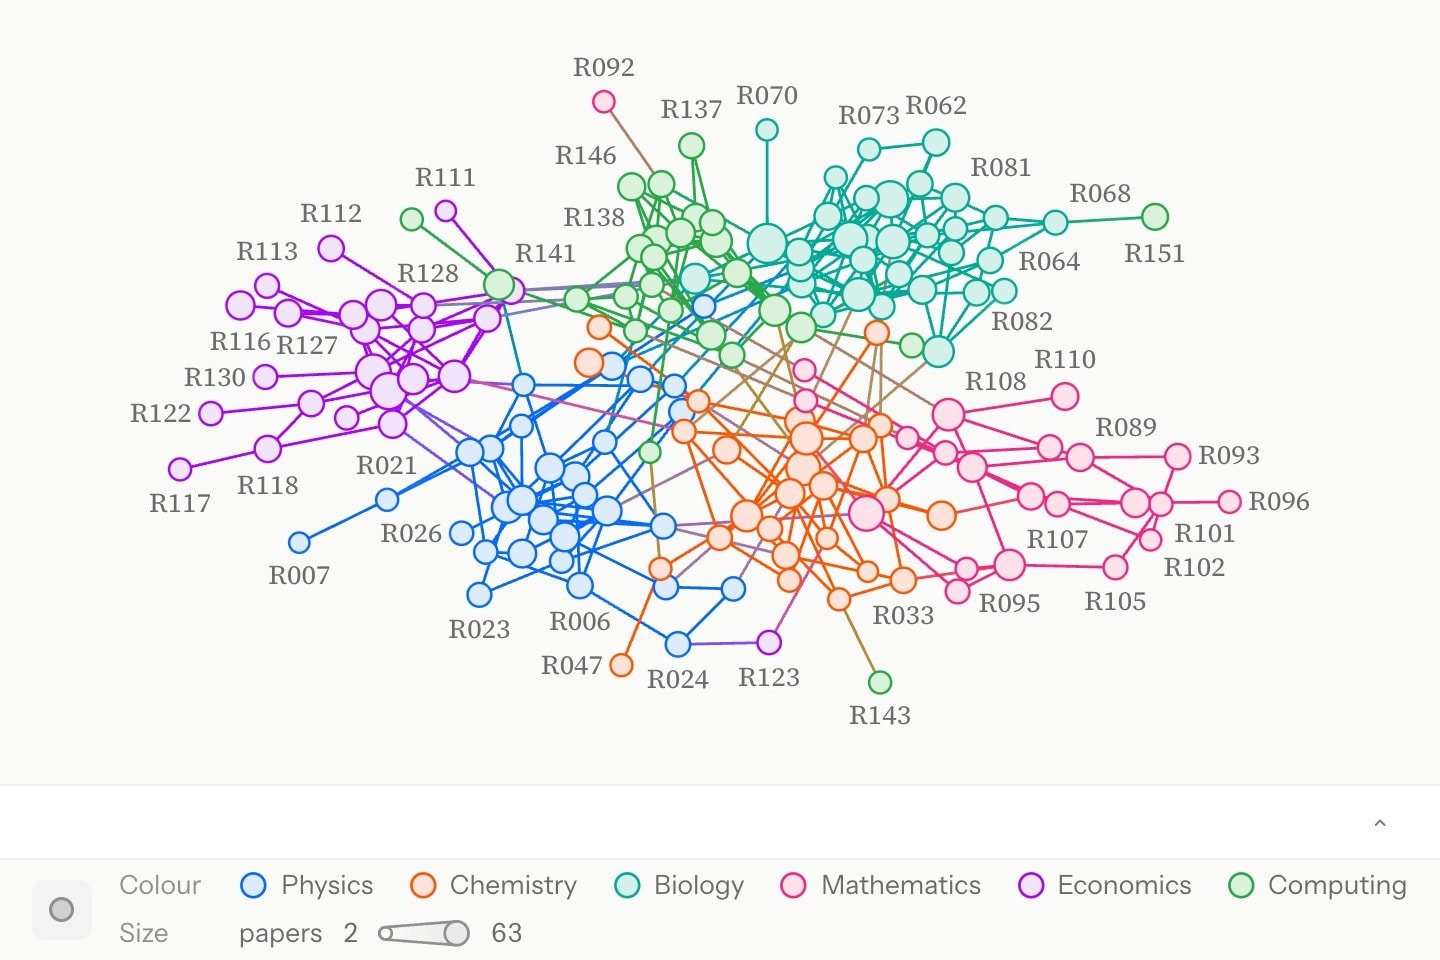
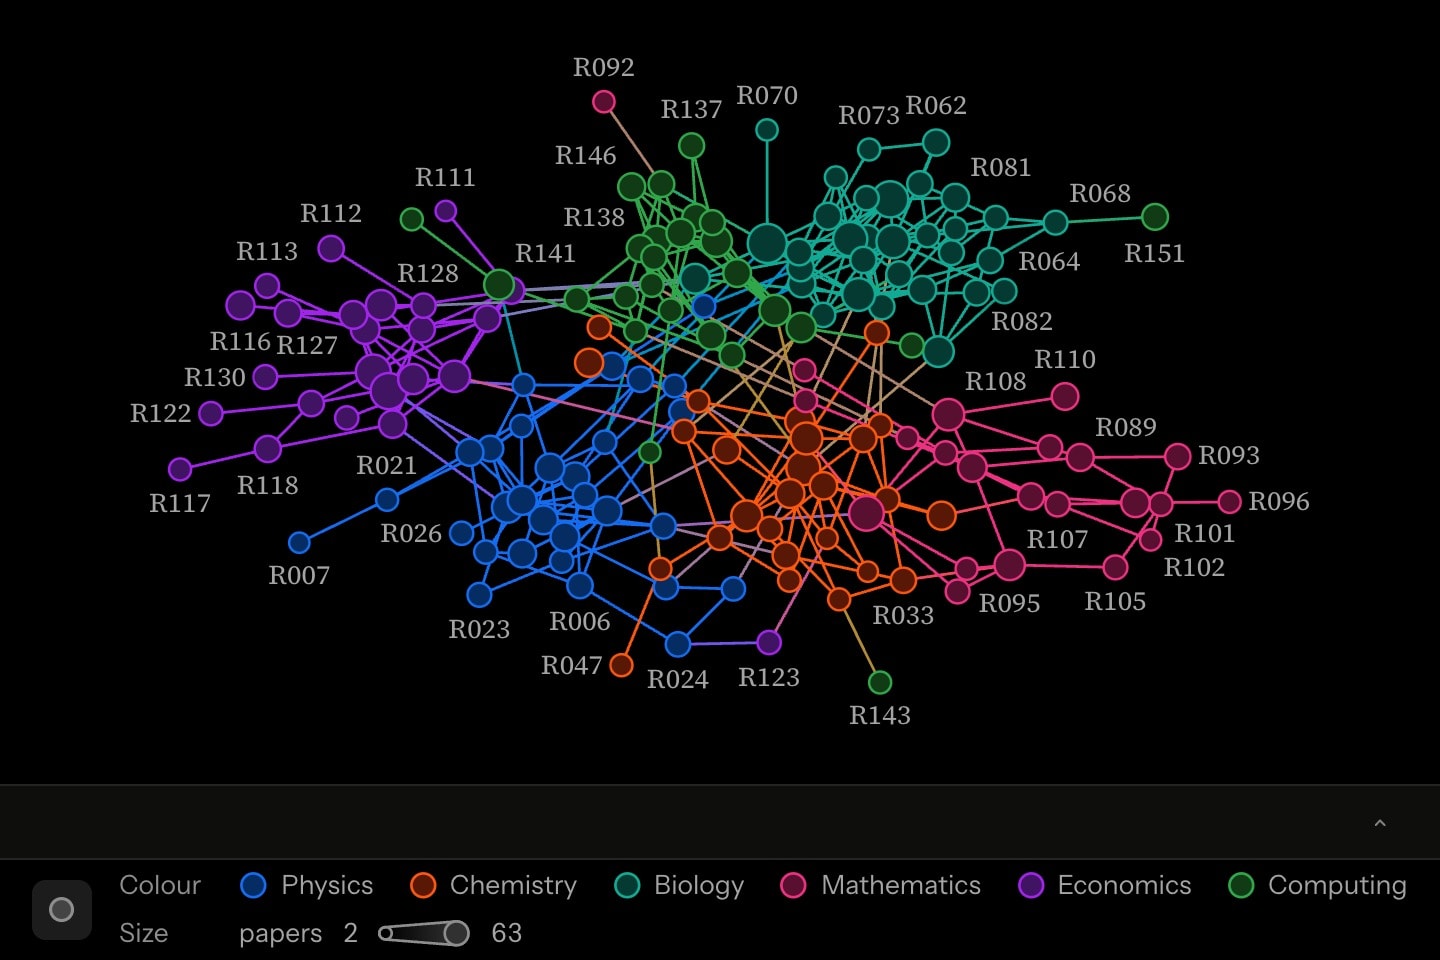
canvas.network{
    vertices(names: #researchers.name; sizes: #researchers.papers; groups: #researchers.department; colour by: group)
    edges(from: #coauthors.a; to: #coauthors.b; colour by: ends)
}#Measuring the network
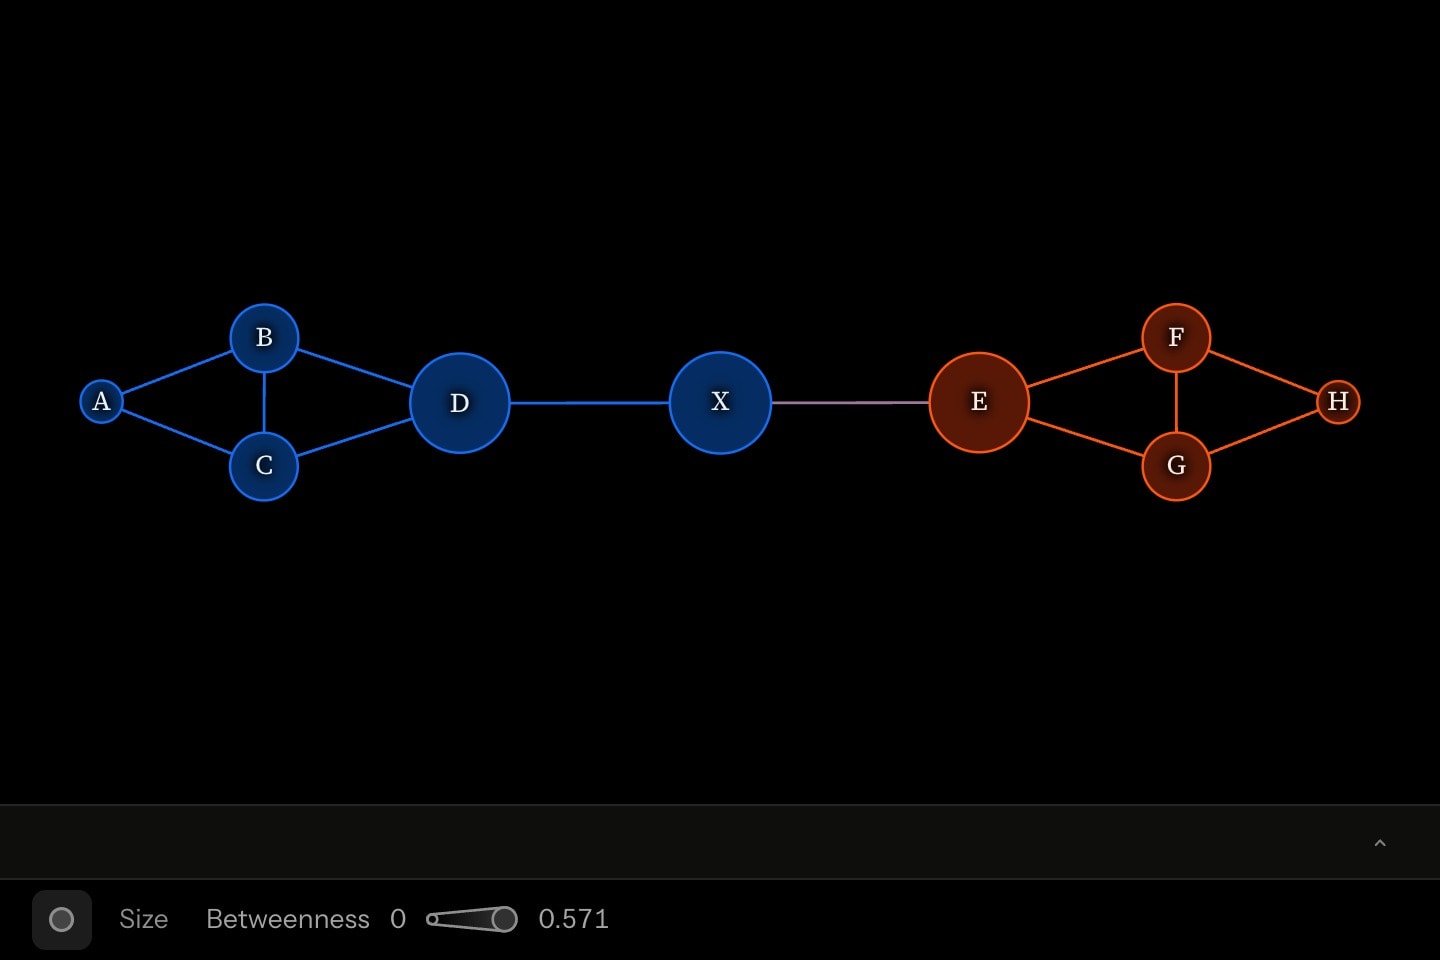
Each vertex derives degree, in-degree, out-degree and betweenness — the share of shortest paths between other vertices that pass through it, 0 to 1. The environment derives vertices, edges, components, communities and density. Prose cites them as any live value: {{#hub.degree}}, {{#net.components}}. They are measurements of the whole declared network, so a cited number does not change as the picture builds.
A vertex table's size by: gives each vertex an area in proportion to degree, in-degree, out-degree, betweenness or weight (the summed weight of its edges). Its colour by: colours vertices by connected component — which piece of the network a vertex is in — or by community: the densely knit clusters the Louvain method finds within a piece. An edge list's width by: weight thickens each edge by its weight. A vertex's own colour: and size: still apply.
A table with no names:, or a list with no from: and to:, lists no rows: its rules cover every vertex no named table lists, or every inline edge. A network written inline is sized by one line, vertices(size by: degree).
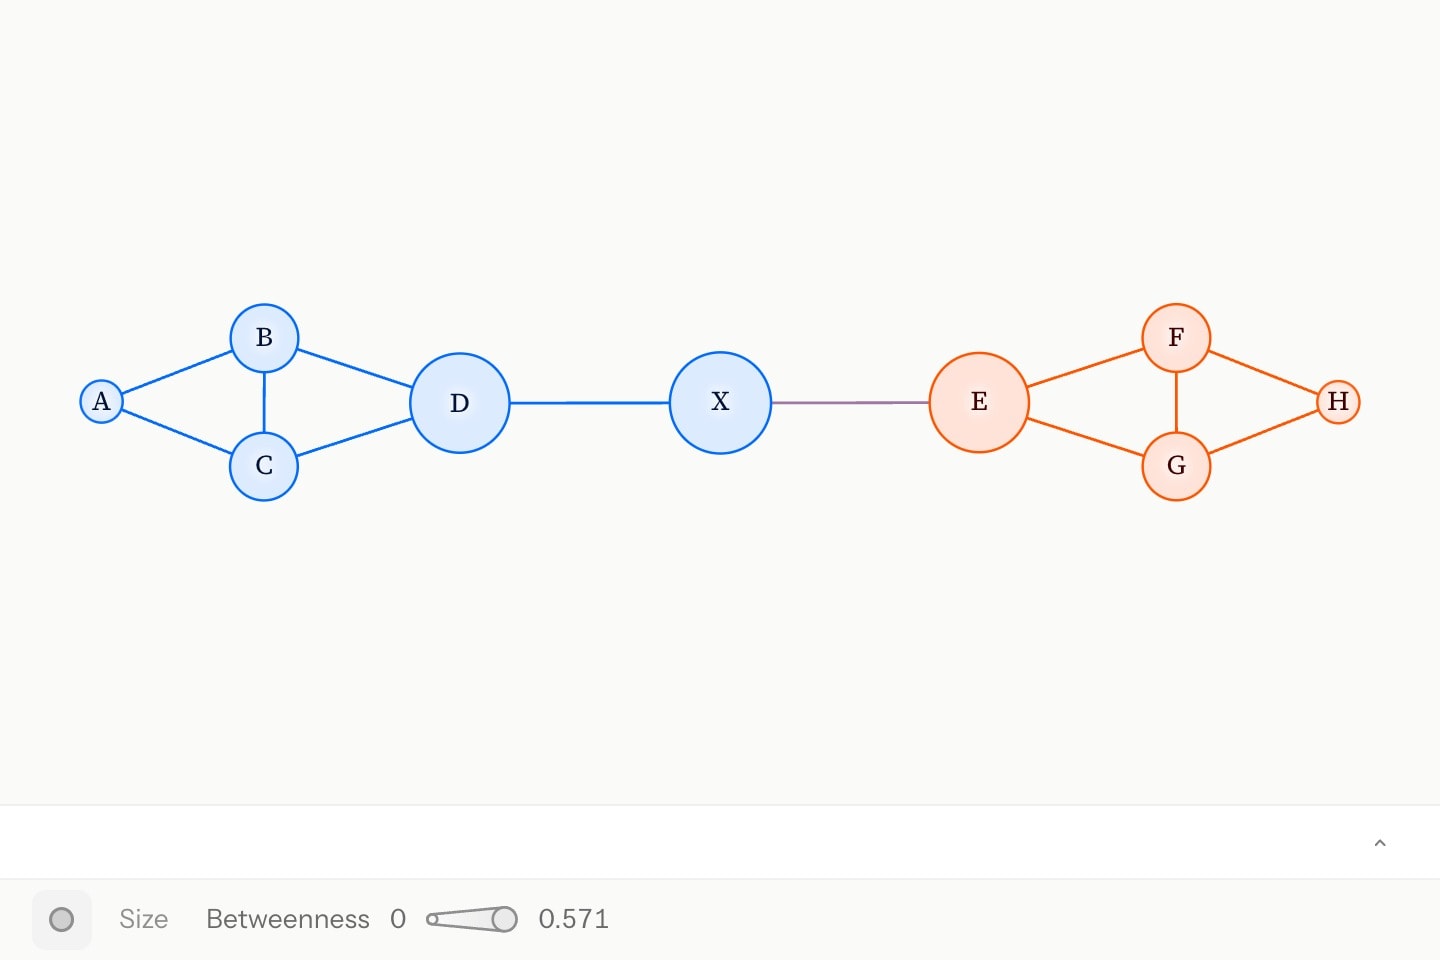
@data#pairs{
    a | b
    A | B
    A | C
    B | C
    C | D
    B | D
    E | F
    E | G
    F | G
    G | H
    F | H
    D | X
    X | E
}

canvas.network{
    vertices(size by: betweenness)
    edges(from: #pairs.a; to: #pairs.b; colour by: community)
}#Shortest paths
path is the shortest route through the vertices through: names, in turn: path(through: #a, #f) from a to f, path(through: #a, #c, #f) from a to c and on to f. It counts weights where the network has them and follows direction on a directed network. It is drawn as a broad stroke over the edges it takes, and derives length and hops. Under cue.draw it strokes in hop by hop.
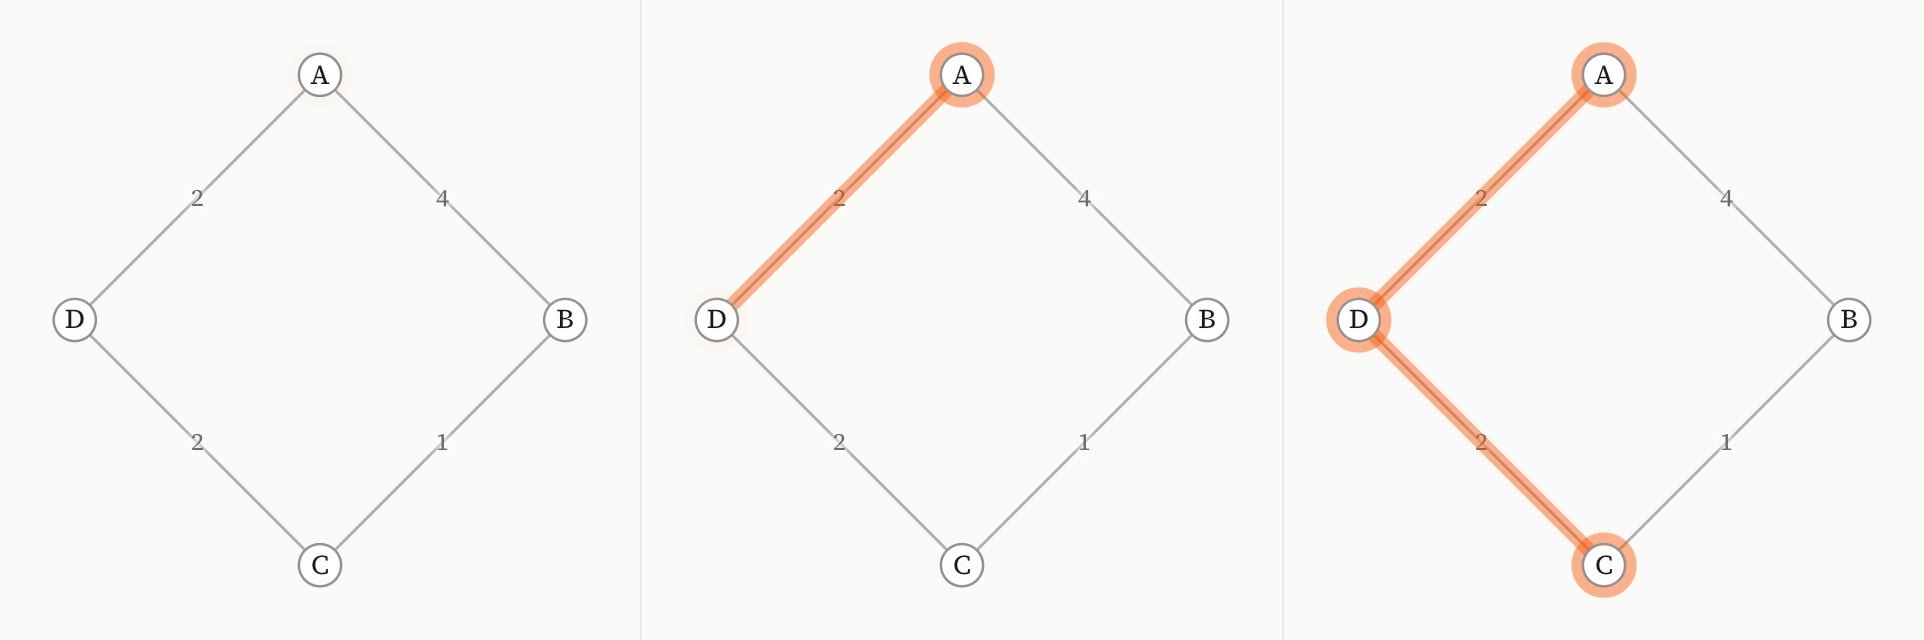
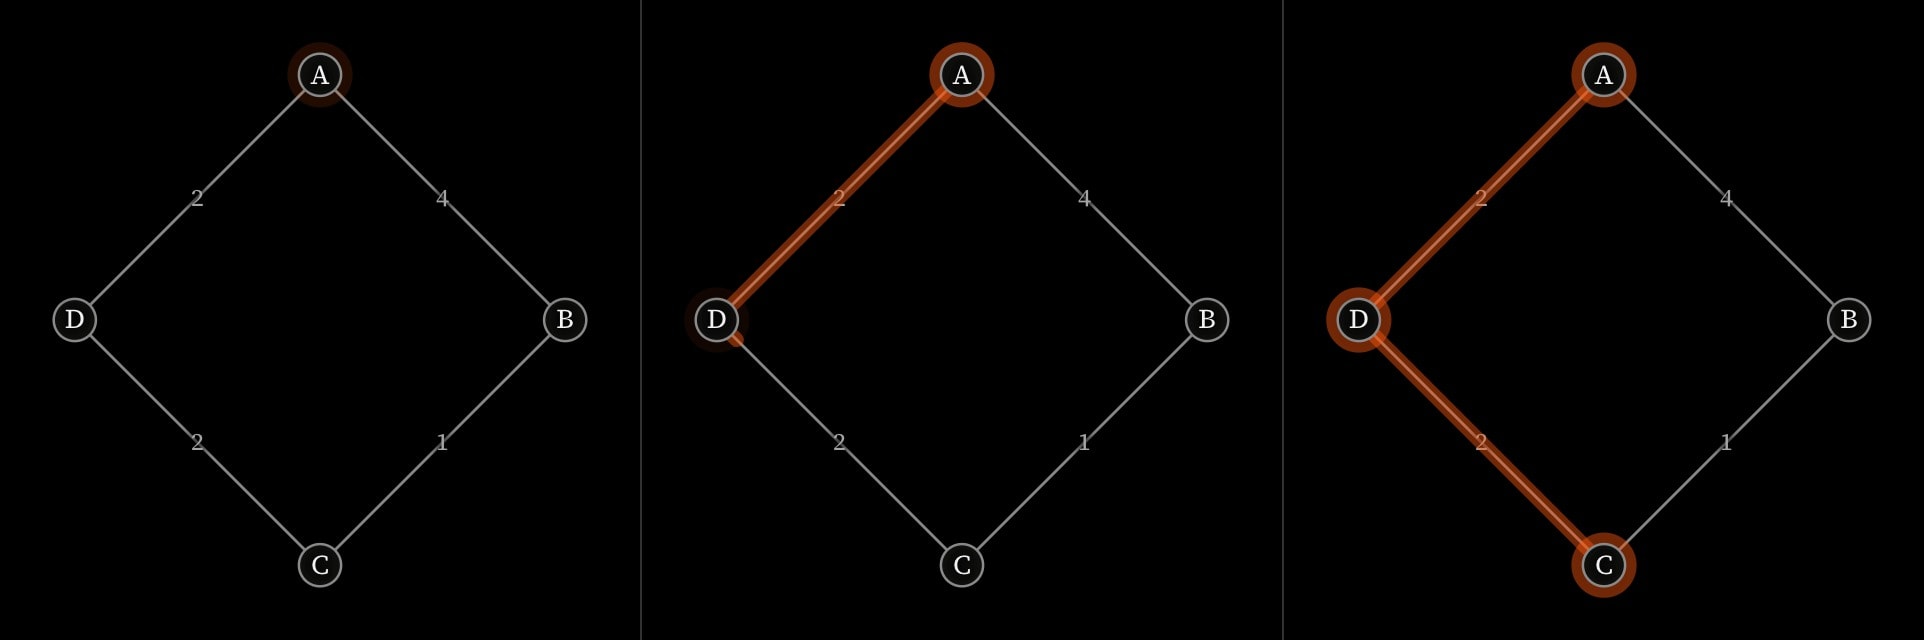
canvas.network:circle{
    vertex#a{A}
    vertex#b{B}
    vertex#c{C}
    vertex#d{D}
    edge(from: #a; to: #b; weight: 4)
    edge(from: #b; to: #c; weight: 1)
    edge(from: #a; to: #d; weight: 2)
    edge(from: #d; to: #c; weight: 2)

    cue.draw{
        path(through: #a, #c)
    }(
        in: 1
        in duration: 1.4s
    )
}(
    show weights
)
Where some leg has no route — a directed network with no way back, two components — the path draws nothing and derives nothing, so prose citing its length reads as absent rather than as a wrong number.
#focus and zoom
focus: names what the camera looks at, and the camera finds the zoom from it. fit, the default, is the whole network. #ids of vertices or paths are framed together; a path, by its route; a single vertex, among its neighbours, since what a vertex connects to is what it means. A fractional point centres the fit there. It animates with !cue.to, the camera flying between the frames: focus: fit !cue.to{#hub}(at: 1; over: 1.4s). Vertices keep their size as the frame closes in, so a dense neighbourhood pulls apart rather than magnifying the tangle. interactive hands the reader wheel-zoom and drag, with a double-click back to the authored frame.
#Attributes
layoutforce draws connected vertices together and pushes every vertex away from the others, seeded by seed: so it comes out the same every time. circle sets them round a ring, each group: kept together. grid sets them in rows in the order written. tree hangs a breadth-first spanning tree from root:. layered ranks a directed network so its edges run one way. bipartite sets the two sides of a two-sided network on two ranks — the two group:s when exactly two are written, otherwise the sides a two-colouring finds.forcecirclegridtreelayeredbipartitecanvas.network:valueforcedirectionfrom to to, and how that is shown. none is an undirected network. arrows and curves are directed — in- and out-degree are measured separately, and a path follows the edges' direction — and differ only in the drawing: arrows puts a head at the end; curves draws no head and bows every edge to the right of the way it travels, so an edge read clockwise runs forward and a reciprocal pair separates by itself — the convention for large directed networks, where heads crowd into every vertex.nonearrowscurvesnoneflowtree, layered and bipartite run: ranks stack downward, or rightward. The other layouts ignore it.downrightdownroot#id of the vertex a tree hangs from, and an undirected layered ranking starts at. Absent, the first vertex written — on a directed network, the first with no edge pointing into it.network-refseed0show-weightslabel: of its own with its weight.weightsfalselegendtruetitlefocusfit, the default, is the whole network. #ids of vertices or paths are framed together: several, the smallest frame holding them all; a path, its route; one vertex, the vertex among its neighbours. A fractional point centres the fit there. Animated with !cue.to, the camera flies between the frames: focus: fit !cue.to{#hub}(at: 1; over: 1.4s). Vertices keep their size as the frame closes in, so a dense neighbourhood pulls apart.network-focusfitinteractivefalsecontinuecontinue: #that-environment. The reader's explored camera carries forward; every authored attribute is the new environment's own.#Derived attributes
Computed while the element renders — read one with #id.name in attribute position or {{#id.name}} in prose, never set.
verticesedgescomponentscommunitiesdensity#Allowed content
#Allowed in
#Examples
canvas.network:circle{
    vertex#a{A}
    vertex#b{B}
    vertex#c{C}
    vertex#d{D}
    edge(from: #a; to: #b; weight: 4)
    edge(from: #b; to: #c; weight: 1)
    edge(from: #a; to: #d; weight: 2)
    edge(from: #d; to: #c; weight: 2)
    cue.draw{
        path#route(through: #a, #c)
    }(
        in: 1
    )
}(
    show-weights: true
)canvas.network{
vertex#uk{United Kingdom}(colour: blue)
vertices(size-by: weight; colour-by: community)
edges(from: #trade.exporter; to: #trade.importer; weights: #trade.value; width-by: weight; colour-by: ends)
}(
direction: arrows
)